Servicios Personalizados
Articulo
Latin American applied research
versión impresa ISSN 0327-0793
Lat. Am. appl. res. v.32 n.2 Bahía Blanca abr./jun. 2002
Application of a Monte Carlo method for the evaluation of reactivity ratios in the copolymerization of furfuryl methacrylate with N-vinyl-2-pyrrolidone
D. Zaldívar‡, G. Fuentes‡, D. Monett‡, C. Peniche‡, R. W. Arcis‡, A. Soto‡ and J. San Roman†
‡Biomaterials Center (BIOMAT), University of Havana, P.O. Box 6130, CP 10600, Havana, Cuba. gastonfe@biomat.uh.cu
†Institute of Polymer Science and Technology, CSIC, 3 Juan de la Cierva St., 28006, Madrid, Spain
Abstract — Copolymers of furfuryl methacrylate (M) with N-vinyl-2-pyrrolidone (P) were prepared by free radical copolymerization in DMF solution at 50°C, using 2,2'-azobisisobutyronitrile (AIBN) as initiator. The reactivity ratios of both monomers were calculated according to the general copolymerization equation using the Fineman-Röss and Kelen-Tüdos linearization methods, as well as the Tidwell-Mortimer non linear least-squares treatment and the Monte Carlo random method. The values of the reactivity ratios calculated using the first methodology were rM = 3.92 and rP = 0.004. Similar results were obtained by both, the Monte Carlo and the non-linear least square techniques that certified the precision of the proposed method. The microstructure of copolymer chains based on the first order Markov statistics is described.
Keywords — Reactivity ratios, Copolymerization, Microstructure, Furfuryl methacrylate, N-vinyl-2- pyrrolidone.
I. INTRODUCTION
The classical copolymerization model describes the relative change in monomer concentrations (d[M1]/d[M2]) as a function of the instantaneous monomer concentrations, [M1] and [M2], and the monomer reactivity ratios, r1 and r2, by means of the general copolymerization equation:
 | (1) |
that can be written as
 | (2) |
in function of one of the monomers (f is feed composition and F is the copolymer composition) (Galego et al., 1987).
The reactivity ratios are not just parameters suited for the estimation of relative reactivities of monomers, but their correct utilization provides valuable and precise information for the determination of micro-structural parameters such as distribution of units and sequence lengths along the macromolecular chains (Elias, 1977). Therefore, the calculation procedures employed for the determination of r1 and r2 must be adjusted as quantitatively as possible to the experimental behavior of the copolymerization system.
The different methods proposed for calculating the reactivity ratios can be classified as: approximation (Alfrey, 1952), curve fitting (San Román and Madruga, 1985), intersection (Mayo and Lewis, 1944), linearization (Fineman and Röss, 1950, Eqn. 2; Kelen and Tüdos, 1975, Eqn. 3) and non-linear least squares methods (Behnken, 1964; Tidwell and Mortimer, 1965). It has been pointed out by Tidwell and Mortimer that the first four methods are not entirely satisfactory, since they all rely on a subjective weighting of data in the evaluation of the reactivity ratios. Also they do not provide possible means of establishing the quantitative error limits for the computed values. On the other side, the non-linear least squares method derived by Tidwell and Mortimer gives the best pair of values of reactivity ratios, independently of any subjective judgement of the experimental data and allows to quantify the errors in meaningful terms. However, the majority of researchers report the reactivity ratios using one of the methods derived from the composition equation, possibly due to the mathematical complexity of the non-linear least squares method.
In the present paper a new procedure for the calculation of r1 (rM) and r2 (rP) based on random techniques for parameter estimation (Monett et al., 1994) is presented and applied to know the fitness of the reactivity ratios for the furfuryl methacrylate/ N-vinyl-2-pyrrolidone copolymerization system. The results are compared with those of other methods and the values of reactivity ratios obtained are used to calculate the micro-structural parameters of the copolymers.
II. METHODS
A. Monomer preparation and purification of materials
Furfuryl methacrylate was prepared by transesterification of methyl methacrylate with furfuryl alcohol in presence of sodium carbonate a catalyst and ionol as inhibitor. The product was distilled, dissolved in chloroform and passed through a chromatographic column containing Silica Gel 60 (Macherey-Nagel, Germany). The eluent was analyzed by thin layer chromatography using Kieselgel 60 F 254 (Merck, Germany) as the stationary phase. The selected fraction was rotoevaporated in order to separate the solvent and distilled.
N-vinyl-2-pyrrolidone was distilled under reduced pressure of nitrogen and used without further purification.
2,2'-Azobisisobutyronitrile (AIBN) was purifiedby fractional crystallization from methanol, mp = 104°C.
N,N-Dimethylformamide (DMF) was dried over anhydrous magnesium sulfate for 2 days and later with phosphoric anhydride overnight. After drying, DMF was distilled under reduced pressure of nitrogen.
Other reagents were of extra-pure grade and used as purchased.
B. Polymer characterization
The copolymers obtained from different mixtures of M and P were analyzed by H-NMR spectroscopy with a Bruker AM-200 spectrometer working at 200 MHz. The spectra recorded at 40°C in 5 % (w/v) deuterated dimethylsulphoxide solutions with a 2400 Hz spectral width, flip angle of 30° (2 ms pulse), a pulse repetition time of 2 s and 128 transients. A 16 K FID was acquired and zero filled to 32 K before Fourier transformation. The analysis was performed by comparing the integrated intensities of resonance signals with chemical shifts of 6.36 d, assigned to the protons in position 3 and 4 of the aromatic furfuryl ring and 3.10 d assigned to the protons in position 4 of the pyrrolidone ring (Zaldívar et al., 1992).
C. Copolymerization
Copolymerization reactions were performed in DMF solution at 50 ± 0.1°C, in Pyrex glass ampoules sealed off under high vacuum. Monomer and initiator concentrations were 1.0 mol/L and 0.015 mol/L, respectively.
The sealed ampoules were shaken vigorously and immersed in a water bath held at the required temperature of polymerization. After the proper reaction time, the ampoules were removed from the bath and at once the content was poured into a large excess of diethyl ether.
The precipitated samples were washed with the precipitant mixture and dried under vacuum until constant weight was attained.
D. Monte Carlo method
The knowledge about the real value of the reactiv ity ratios was very scarce. For the identification of these constants a parameter estimation method of exploratory type (Monte Carlo method) was selected (Monett et al., 1994).
Monte Carlo method carries out a random search in the whole domain D,
| | (3) |
where Iq = [Lq, Uq] is the interval of variation corresponding to the reactivity ratio q, and Lq and Uq are the inferior and superior limits of Iq. The D domain is a Cartesian product of intervals, defined as the widest region where the reactivity ratios vary. Therefore, a pair (rM , rP) belongs to D. Then, rM Î IM = [LM , UM] and rP Î IP = [LP, UP].
For this purpose as many combinations as desired of probable values for the unknown reactivity ratios are generated, each one within their corresponding interval. The greater the number of value combinations (C), the better the covering of the
interval for the solution searching. The generation of combinations of reactivity ratios or tuples ![]() , is at random with each constant rtq uniformly distributed in Iq. Each combination w is evaluated using the general equation of copolymerization (2). The solutions
, is at random with each constant rtq uniformly distributed in Iq. Each combination w is evaluated using the general equation of copolymerization (2). The solutions ![]() , are obtained where N is the number of experimental values.
, are obtained where N is the number of experimental values.
Among the generated tuples a selection is made based on the distance dw between the experimental values of the general equation of polymerization and the solution Stw calculated for each generated tuple:
| | (4) |
where fexp are the experimental values of the monomer in copolymer with respect to time and e is a fixed positive number. The selected tuples will be the ones giving the best fit to the expected kinetical behavior. Different norms ( L1 , L2 and L∞ ) in the calculus of the above distance were used. The L2 norm or well known Euclidean distance,
 | (5) |
was selected for the results shown in this article.
The selected tuples yield an optimal domain Dopt Ì D,
| | (6) |
where
i)
ii) ![]() defines the minimum value for q under Eqn. (4),
defines the minimum value for q under Eqn. (4),
iii)![]() defines the maximum value for q under Eqn (4), which defines the region where the best reactivity ratio combinations are contained.
defines the maximum value for q under Eqn (4), which defines the region where the best reactivity ratio combinations are contained.
Dopt gives a good region of starting points for some other optimization methods like Levenberg-Marquardt, Gauss-Newton and Sequential Quadratic Programming.
With the purpose of determining the most reliable intervals for the parameters, Monte Carlo method was applied several times starting with different initial random seeds and maintaining the original intervals. From each run and optimal domain Dopt, the behavior of the results in the different intervals Iq was analyzed. Each of these intervals was divided into three disjoint subintervals: ![]() where
where ![]() is defined by the set of values of q from the selected tuples,
is defined by the set of values of q from the selected tuples,![]() and
and![]() contains none and
contains none and ![]() ,
, ![]() ,
, ![]() ,
, ![]() , and
, and ![]() . These bounds were averaged along the different runs (M, number of runs) and three new general intervals were defined:
. These bounds were averaged along the different runs (M, number of runs) and three new general intervals were defined:
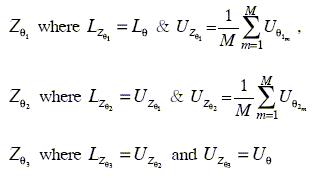
At the same time statistical analyses of the behavior of the upper and lower limits of each interval were made.
The analyses show that these limits remain almost without changes in the different runs.
Afterwards, the general intervals were successively used as the original interval Iq. For example, using ![]() as Iq none of the tuples could be selected because all of them failed the e condition (4).
as Iq none of the tuples could be selected because all of them failed the e condition (4).
On the other hand using ![]() as Iq and repeating several times the whole process, (that is, obtaining a new interval, say
as Iq and repeating several times the whole process, (that is, obtaining a new interval, say ![]() , and using it again as Iq, and so on) a progressive refinement of the initial Iq interval was obtained.
, and using it again as Iq, and so on) a progressive refinement of the initial Iq interval was obtained.
III. RESULTS AND DISCUSSION
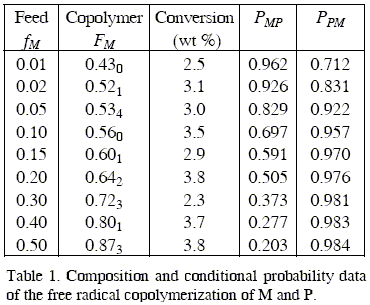
The copolymerization of furfuryl methacrylate with N-vinyl-2-pyrrolidone in anhydrous DMF solutions were studied in a wide composition interval with molar fractions of M ranging from 0.01 to 0.50 in the monomer feed.
The reaction time was initially regulated to reach conversions lower than 5 wt % , in order to satisfy the differential copolymerization equation.
The molar fraction of monomers units incorporated in the copolymers was determined from the 1H-NMR spectra of copolymers samples prepared with different monomer feeds.
The data of molar composition of the initial mixtures of comonomers used and the resulting copolymers are quoted in Table 1.
The reactivity ratios of the monomers were determined according to the general copolymer composition equation (2) by the application of the Tidwell and Mortimer non linear least squares analysis.
To this end, initial approximated values of rM and rP were obtained by means of the Fineman- Röss (Fineman and Röss, 1950, see Eqn.7) and Kelen-Tüdos (Kelen and Tüdos, 1975, Eqn. 8) linearization methods:
 | (7) |
where F refers to composition in copolymer and f refers to composition in feed, both cases according to the principal monomer;
 | (8) |
where G = x (y-1) / y, E x2 / y, x = [M] / [P], y = d [M] / d [P] and ![]() .
.
The results are shown in Table 2 where FR refers to the Fineman-Röss linearization method, KT, to the Kelen-Tüdos linearization method, TM to the Tidwell-Mortimer non linear squares method and MC to Monte Carlo parameter estimation. It must be pointed out that although the rM and rP values obtained using the linearization methods are somewhat different, they give the same reactivity ratio values when fed to the nonlinear least squares method.
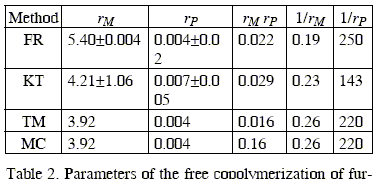
We stress here that the reactivity ratios determined by the application of the analysis suggested by Tidwell and Mortimer (Tidwell and Mortimer, 1965) and Soto and Monett (Monett et al., 1994) are the most probable values for this system. In this sense, the 95 % confidence limit gives an idea of experimental error and the correctness of the experimental conditions used to generate the composition data.
When the experimental error is reasonably small and the data have been taken under the appropriate conditions, the approximation can be remarkably good. The application of this treatment to the copolymerization data reported in Table 1 and the reactivity ratios quoted in Table 2 provides the 95 % confidence limits.
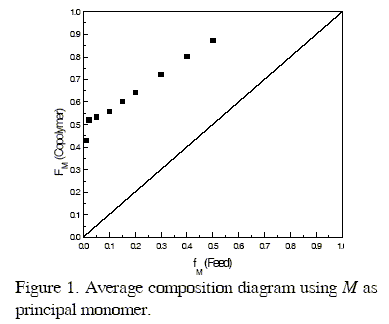
The average composition diagram shown in Fig. 1 has been drawn with the Monte Carlo rM and rP values using the Mayo-Lewis classical copolymerization equation (see Eqn. 9) (Galego et al., 1987); the experimental composition data fit adequately the theoretical diagram represented by the solid line,
 | (9) |
The reactivity of growing radicals with M ends, as measured by the ratio 1/rM, and the reactivity of the growing radical with P ends, as measured by the ratio 1/rP are rather similar towards both monomers and the product rMxrP is far to unity, indicating that the system does not behave closed the ideal one.
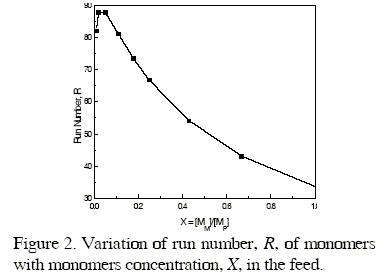
From the values of the reactivity ratios rM and rP given in Table 2 and taking into account well known statistical relationships, we have determined the run number, R, defined by Hardwood and Ritchey (Hardwood and Ritchey, 1964) as the average number of monomers alternations in a copolymer per 100 monomeric units. This parameter provides a useful picture of the sequence distribution in a copolymer chain and can be used to estimate the variation of the physical properties of copolymers with the composition. Values of R have been determined in terms of reactivity ratios and probability statistics for different values of the molar fraction of M in the feed, covering a wide interval of compositions. The maximum value of R = 87.87 is reached for a M molar fraction in the feed of about 0.05 as shown in Fig. 2.
The statistical distribution of M centered triads were determined considering the equations for the first order Markovian transition probabilities PMP, PPM, PMM and PPP according to the following equations
 | (10) |
 | (11) |
where X = [M]/[P] represents the ratio of the concentration of M and P in the monomer feed. Figure 3 shows the diagrams of the statistical distribution of M centered triads along the copolymer chains, as function of the ratio of molar concentration of both monomers in the feed.
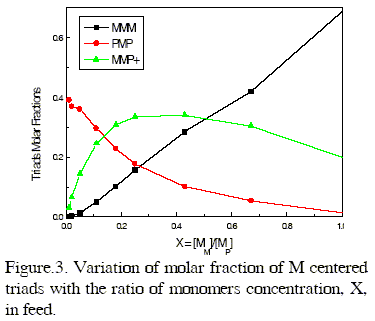
As it is expected the PMP triad molar fraction decreases smoothly whereas the molar fraction of homotriads MMM increases drastically, with increasing X. However, the molar fraction of heterotriads having one P unit, MMP+ = MMP + PMM, reaches a maximum of 0.3413 for X = 0.43.
IV. CONCLUSIONS
The monomer reactivity ratios for the copolymerization of furfuryl methacrylate with N-vinyl-2-pyrrolidone are rM = 3.92 and rP = 0.004, respectively. This indicates the extremely higher reactivity of the growing radical with M ends towards furfuryl methacrylate, which is reflected in the microstructure of the copolymer formed. The Monte Carlo method used for the evaluation of the reactivity ratios gives the same result as the non-linear least squares procedure of Tidwell and Mortimer and can therefore be used as an alternative.
ACKNOWLEDGMENTS
The authors wish to acknowledge the financial support provided by the cooperation program between CSIC (Spain) and CECE (Cuba) as well as by the Grant Mat 88-0579-C02-01 from the CICYT.
REFERENCES
1. Alfrey, T., J. J. Bohrer and H. Mark, Copolymerization, Wiley Intersciences, New York (1952).
2. Behnken, D. W., "Estimation of copolymer ratios: an example of non linear estimation" J. Polym. Sci., Part A 2(2), 645-648 (1964).
3. Elias, H. G., Macromolecules, Wiley Inter-sciences, New York (1977).
4. Fineman, M. and S. D. Ross, "Linear method for determining monomer reactivity ratios in copolymerization" J. Polym. Sci. 5, 259-262(1950).
5. Galego, N., R. Martínez, C. Peniche, S. Prieto and J. Rieumont, Química Física de los Polímeros, Ed. Científico-Técnica, Cuba (1987).
6. Harwood, H. J. and W. M. Ritchey, "The characterization of sequence distribution in copolymers" J. Polym. Sci. Part B 2(6), 601-607 (1964).
7. Kelen, T. and F. Tudos, "New improved linear graphical method for detemining copolymerization reactivity ratios" React. Kinet. Catal. Lett 1, 487-492 (1974).
8. Monett, D., G. Fuentes, W. Arcís, D. Zaldívar, J. Lange and A. Soto, "Nuevo programa informático aplicable al estudio de una copolimerización: COPOLIM" Revista de Plásticos Modernos 459, 231-237 (1994).
9. San Román, J. and E.L. Madruga, "Nuevos enfoques en la copolimerización" Revista de Plásticos Modernos 344, 199-208 (1985).
10. Tidwell, P. W. and G. A. Mortimer, "An improved method of calculating copolymerization reactivity ratios" J. Polym. Sci. A3(1), 369-387 (1965).
11. Zaldívar, D., C. Peniche, A. Bulay and J. San Román, "Free radical copolymerization of furfuryl methacrylate and n-vinyl-2-pyrrolidone", Polymer 33, 4625-4629 (1992).
Received: December 30, 1997.
Accepted for publication: February 1, 1999.
Received in final form: February 10, 2002.
Recommended by Subject Editor R. Williams.


