


Serviços Personalizados
Artigo
 pdf em Inglês
 Artigo em XML
 Referências do artigo
 Permalink
Latin American applied research
versão On-line ISSN 1851-8796
Lat. Am. appl. res. vol.43 no.1 Bahía Blanca jan. 2013
CFD study for gas and gas-solid flows in high-efficiency cyclones: comparison between a new design and stairmand type
D. Bahamon†, H. H. Alzate† and G. C. Quintana†‡
† Chemical Engineering Department, Universidad Pontificia Bolivariana, Cq. 1 N° 70-01, Medellín, Colombia
‡ german.quintana@upb.edu.co
Abstract— Cyclones are equipments used for gas-solid separation in many applications at industrial level, however, they are considered low-efficiency devices and their design have been simplified to basic models without further improvements. This paper presents a numerical study by Computational Fluid Dynamics (CFD) for gas and gas-solid flows in two designs of High-Efficiency (H.E.) cyclones: the commonly known Stairmand cyclone and one proposedbyLópez, Trujillo and Quintana (LTQ) that showed better performances according to preliminary calculations. The turbulence of the gas flow was obtained by the Reynolds Stress Model (RSM). The pressure and velocity fields of both geometries were analyzed. The results indicate that the proposed design has lower pressure drops and higher collection efficiency for the given operation conditions, allowing savings in operating costs.
Keywords— Cyclone Separators; Gas-solid Flows; Reynolds Stress Model; CFD.
I. INTRODUCTION
Due to the low operating cost, the lack of moving parts and be adaptable to a wide range of operations, cyclone separators have application in many different industries: from processing of cement, coal and wood, through the manufacture of chemical and pharmaceutical products, and even in the refining of sugar (Hoffmann and Louis, 2004; Peres, 2002). For some time these have been considered low-efficiency devices, however by improving the technical requirements in design, starting with a good understanding of flow dynamics inside the separators, the performance parameters can be optimized and thus achieving better cost-effectiveness ratios.
Despite its apparent simplicity, the flow in a cyclone is complex: includes features such as vorticity and, in some cases, several annular zones of reverse flow which are not satisfactorily predicted by the confined vortex flow theories (Gimbun et al., 2005; Witt et al., 1999). Moreover, the problem associated with the detailed mathematical modeling of flow profiles involves solving the tightly coupled nonlinear partial differential equations for momentum and mass conservation, which have no analytical solution and must be solved using discretization methods.
Simulation using Computational Fluid Dynamics (CFD), whose techniques convert the partial differential equations into a set of algebraic equations and solve these by iterative methods, emerges as a suitable and economical tool for understanding the complex flow dynamics within these devices and how it is affected by changes in the original design or operating conditions (Bernardo et al., 2006; Patankar, 1980). The calculations can be used in a wide range of flows in order to decrease the need for experimental evidence, allowing predictive analysis in the design process and evaluation of industrial processes, reducing factors such as cost, risk and time (Ranade, 2001).
López et al. (2005) proposed new geometric configurations for three types of cyclones using existing correlations: LTQ high-efficiency, LTQ high-capacity and LTQ conventional. Nevertheless, given the nature of these empirical equations, there is not a theoretical foundation for validation, and that is in partly what motivates this work.
In this paper we present numerical simulations of gas and gas-solid flows for two models of high-efficiency cyclones: LTQ, comparing with the traditionally used Stairmand cyclone. The purpose is to obtain the velocity and pressure fields of both cyclones and to describe the trajectories of the particles within the two devices, in order to validate through a comparative evaluation of performance under given conditions, if LTQ cyclone design is operationally more economical.
II. MATHEMATICAL MODELING
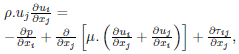
Usually, the fluid flows are mathematically described by a group of partial differential equations: the continuity equation obtained from the mass balance, and the so-called Navier-Stokes equations which are the result of conservation of momentum. For an incompressible fluid flow in steady state, both equations can be expressed in an Eulerian approach as
 | (1) |
 | (2) |
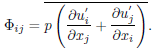
where the subscripts i,j =1,2,3 indicate the components in the coordinate system, ρ denotes the density, ui represents the fluid velocity -both mean and fluctuating velocity-, p the pressure and μ the viscosity. The flow can be considered isothermal, thus the energy conservation equation can be neglected. The Reynolds stress tensor is defined as
 | (3) |
and represents the effect of turbulent fluctuations in the flow. However, the above equations are not completely specified until the Reynolds stress tensor is determined by a turbulence model.
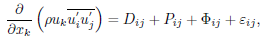
In this item, there are two approach commonly used in simulations with cyclones:  model and Reynolds Stress Model (RSM). The model works under the assumption of isotropic turbulence, so it has limitations for highly rotating flows such as in cyclones. The RSM forgets that isotropic assumption and solves a transport equation for each component of the Reynolds stress tensor as well as for dissipation transport, making it the turbulence model more applicable, even when it has the disadvantage of being computationally more expensive (Wang et al., 2006; Narasimha et al., 2007). The transport equations for Reynolds stress tensor may be written as follows:
 | (4) |
where the left term represent the convective transport and the four terms on the right are:
Diffusive term:
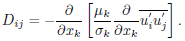 | (5) |
Stress production term:
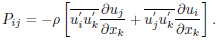 | (6) |
Pressure strain term:
 | (7) |
Dissipation term:
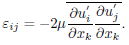 | (8) |
The turbulent dissipation rate,  ,is solved with the following equation:
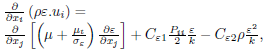 | (9) |
where k is the kinetic energy, and the turbulent viscosity, μt, is determined by:
 | (10) |
The values of the constants appearing in the model are usually assigned as:  .
.
For the solids flow modeling, the interaction between particles is neglected since only dilute flow is considered in this study. The momentum equation of a particle in a two-phase flow can be expressed, using a Lagrangian approach as
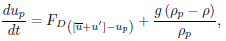 | (11) |
where p, g denotes the particles and gas phase respectively, u' is the fluctuating component of velocity and FD is the drag force of the particle, obtained by
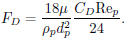 | (12) |
Rep is the particle Reynolds number, which is defined as
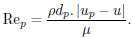 | (13) |
The drag coefficient, CD, is a function of the relative Reynolds numbers, and can be obtained from
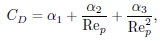 | (14) |
where α1, α2 and α3 are constants for smooth spherical particles over several ranges of Rep (Morsi and Alexander, 1972).
III. SIMULATION CONDITIONS
The equations presented in the preceding paragraph were numerically solved using the commercial CFD code FLUENT in the version 6.3, which employs the finite volume method to discretize the transport equations. The algorithm SIMPLE (Semi-Implicit Method for Pressure-Linked Equations) was used for the pressure-velocity coupling. It was also used a second-order scheme to interpolate the variables on the control volume surface and a convergence criterion of 10−5 in the Euclidean norm in each simulation. The calculations were carried out on a PC with dual-core processor, 1.46 GHz, 3 GB RAM and 120 GB hard disc memory.
Figure 1 lists the geometry for both cyclone designs evaluated: Stairmand -H.E. cyclone and LTQ -H.E. cyclone. The latter generates lower pressure drops, greater separation efficiencies of particles smaller than 14 μm and more slender equipments, according to preliminary estimates by empirical correlations (López et al., 2005). For the cyclone diameters and the general operation conditions, characteristic values were taken of industrial cyclones presented by Koch and Licht (1977), devices used as pre-cleaners of dust emissions generated from a Portland cement furnace. The GAM-BIT pre-processor was used to the meshing in both designs. By a preliminary evaluation of the effect of mesh refinement, a node grid with 201,280 and 213,993 hexahedral elements were selected for the simulations to ensure a reasonable prediction of the pressure and velocity profiles inside the devices respectively. Figure 2 illustrates schematically the structure for Stairmand and LTQ cyclones. The gas phase (air) was assumed at standard temperature and pressure conditions (STP) and four different mass flows were simulated in each cyclone as initial condition : 2,300 kg/h, 4,600 kg/h, 6,900 kg/h and 9,200 kg/h. Boundary conditions were established for the velocity of the fluid entering the domain, the ambient pressure at the outlet and no-slip condition at solid-fluid interface of the cyclone. Initially, the numerical solution was obtained for simple gas phase, and from the predicted flow field, the multiphase gas-solid flow was then solved.
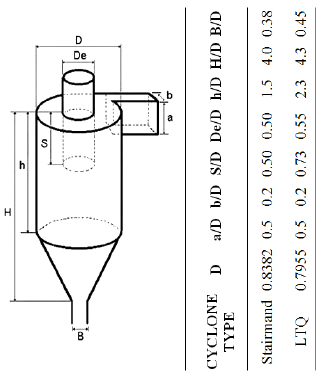
Figure 1: Geometric configurations for H.E. Cyclones
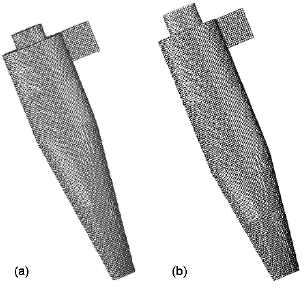
Figure 2: Cyclone geometry and meshing: (a) Stairmand-H.E., (b) LTQ-H.E.
The two-phase flow, with a concentration of solids of 23.1 g/m3, was simulated using the discrete phase model, which predicts the paths of individual particles, each representing a current flowing along the gas. The initial positions of the particles were homogeneously located in a normal position on the inlet surface. The particle inlet velocity was taken equal to the gas inlet velocity. A two-way coupling was performed, i.e. there is interaction between the solids and the gas flow, but there is no interaction among the first ones. For a realistic dispersion of particles, stochastic track was included to model the effect of the turbulence of the gas phase on the trajectories of the particles. It was assumed that when the particle collides any wall, is elastically reflected and the computation continues as bounces off the wall until it escapes from the vortex finder or is collected at the dust outlet.
By the detailed graphics of velocity and pressure profiles generated for the different geometries, as well as the efficiency separation, the performance of both types of cyclones were evaluated and compared to each other.
IV. RESULTS AND DISCUSSION
The results for the simulations, both single and twophase flows, are shown in the following paragraphs through the figures that contain the resulting velocity and pressure fields (the maps and distributions presented correspond to a mass flow of 6,900 kg/h). The absence of experimental evidence does not allow complete validation of the results, however, in qualitative terms, the obtained values provides a good representation of rotational flow inside cyclone separators, and the shape of the velocity and pressure profiles are consistent with those found in the literature (Bernardo et al., 2005; Cortés and Gil, 2007; Wang et al., 2006; Xiang and Lee, 2005; Zhao et al.,2004), due to the physic model used for the problem and the boundary conditions applied.
A. Gas Flow
Figures 3 and 4 show the contours of static and total pressure for both designs. On the left side is the Stairmand-H.E. cyclone and on the right side the LTQ-H.E. cyclone.
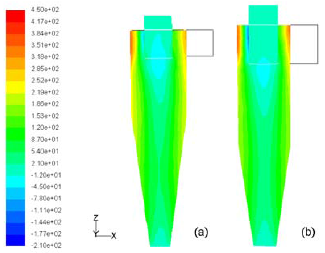
Figure 3: Static pressure maps for cyclones: (a) Stairmand and (b) LTQ. (Gas flow = 6,900 kg/h)
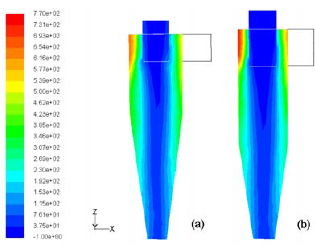
Figure 4: Total pressure maps for cyclones: (a) Stairmand and (b) LTQ. (Gas flow = 6,900 kg/h)
The pressure contours illustrate an expected behavior. It is noted that the pressure has its maximum value at the wall and decreases radially towards the center. In addition, there is a negative pressure zone in the central axis due to the centrifugal force generated by the flow in the device.
Although at first sight the profiles have similarities to each other, there are differences in peak pressure generated in the walls -where the fluid initially reaches the cylindrical body and begins its downward rotational movement-and in the central core.
Making a comparison between the two designs, LTQ cyclone exhibits a central vortex with larger diameter and less fluctuation to the longitudinal axis than Stairmand. Since a larger region of low pressures is generated in the first one, a decrease in collection efficiency may occur due to the increase in drag force to the smaller particles and making them more difficult to reach the walls of the device, however that is not the case. In the next apart it can see clearly the particle behavior within the separator.
Using the total pressure drop definition in cyclones, in Fig. 5 are shown the different values obtained for four different inlet velocities in both designs, and are compared with empirical correlations using nowadays. It is observed that the Casal-Martínez model presents better fitting with the simulations, and an average reduction of 8,7% in pressure drop is achieving with the geometry proposed by López et al., (2005). This reduction translates into savings in operating costs of the equipment.
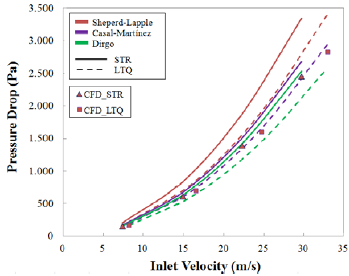
Figure 5: Total pressure drop for different inlet velocities in Stairmand and LTQ cyclones
The tangential velocity profiles and distributions are presented in Figs. 6 and 7. According to the values on the left side on Fig. 6, the red coloured region indicates that the gas at the entrance of the separator is accelerated up to 1.5 times its initial velocity at the point where the fluid starts to experience rotational flow, consistent with the pressure distribution obtained. Then, the velocity decreases as the gas turns and descends along the wall. In Fig. 7 it is also observed, mainly for Stairmand cyclone, that the vortex axis does not coincide with the axis of the cyclone and presents an oscillation at different heights in the cyclone structure, which leads to think that the quasi-periodic phenomenon known as Precessing Vortex Core (PVC) is presented. This is due to the unstable structure of the vortex and can be very detrimental to the ultimate goal of cyclones, because it alters the flow of particulate material in the wall of the device and therefore affect the collection efficiency (Cortés and Gil, 2007).
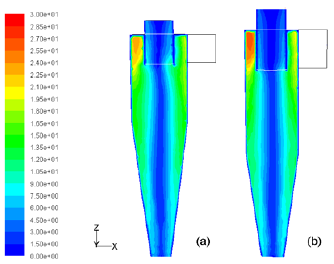
Figure 6: Tangential velocity maps for cyclones: (a) Stairmand and (b) LTQ. (Gas flow = 6,900 kg/h)
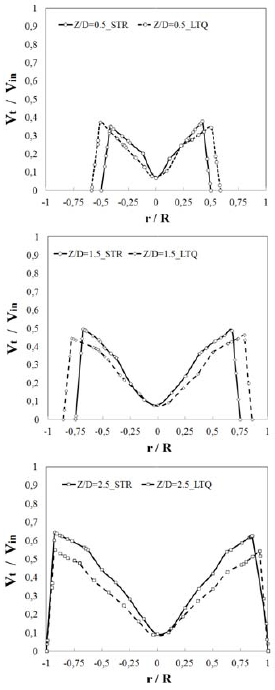
Figure 7: Tangential velocities distributions for different axial positions in cyclones
The simulation was carried out at steady state, showing an average profile that outlines an average behavior of the central vortex, which tends to rotate toward the end of the separator. In LTQ cyclone the central vortex found is more stable and this phenomenon is not seen, however, is not convincing evidence that does not happen. For this case, it is necessary to conduct a more detailed analysis in transient state, possibly using a turbulence model such as the Large Eddy Simulation (LES), which is very useful for detecting microscopic structures in turbulent transitional flows (Martignoni et al., 2007).
On the other hand, Figure 8 presents a comparison of radial distributions for axial velocity in both designs. It is shown that the forced vortex is not completely axi-symmetric due to secondary flows that develop around the vortex finder -as perceived in the rear of both devices-. Before the fluid reaches the vortex finder, it collides with the gas entering and forms a chaotic flow outside the gas outlet duct, and at the same time, the gas velocity decreases sharply and may go in the opposite direction (Wang et al., 2006).
This increases the energy loss and pressure drop in the cyclone, and in this case correlates with the findings above for the pressure fields, i.e., to a more disordered flow as presented by the Stairmand cyclone (left in Fig. 8), the greater the pressure drop across the device. Similarly, LTQ cyclone has a more orderly profile and less well developed in gas outlet duct, which generates lower pressure drops.
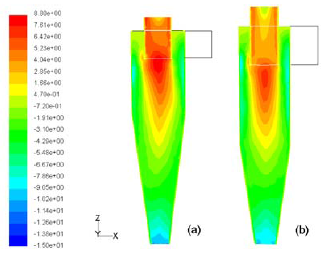
Figure 8: Axial velocity maps for cyclones: (a) Stairmand and (b) LTQ. (Gas flow = 6,900 kg/h)
Figure 9 presents the axial velocity distribution in different zones within the device -the axes are presented dimensionless to quantitatively compare the two designs, and a greater terminal velocity is shown at each height for Stairmand cyclone-. It is noted that the flow is downward in the central axis to a height less than 1.0Z/D from the base in both cyclones, where the direction changes and the flow goes all the way up.
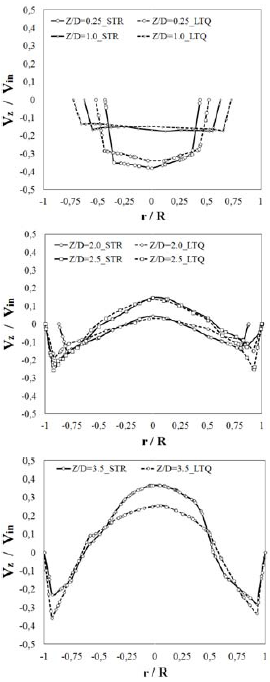
Figure 9: Axial velocities distributions for different axial positions in cyclones
Using Alexander correlations, the natural inflexion length found for a gas flow of 6,900 kg/h (1.59 m3/s) is 2.08 m in Stairmand cyclone and 2.16 m in LTQ cyclone, i.e., the flow changes its direction at 0.86 m and 0.68 m from the base of the device, respectively. These values are similar to what is observed in the axial velocity profiles. In addition, since natural length is greater in LTQ cyclone, the vortex end has less probability to attach at the walls and generates the PVC phenomena. Therefore, it is logical that in the Stairmand design the vortex has a greater tendency to rotate than in LTQ. Likewise, for distances closer to the outlet dust duct there are no W-shaped profiles observed, so there is no recirculation of collected particles that affect the performance of these cyclones, as often occurs in poorly designed equipment (Lee et al., 2006).
B. Gas-Solid Flow
The particle size distribution presented by Koch and Licht (1977) can be adjusted to a Rosin-Rammler function, which is based on the assumption that there is an exponential relationship between the diameter of the particles and the mass fraction of particles with a diameter greater than dP, knowing as Yd. The feed solid has a load of 23.1 g/m3 of a typical Portland cement raw material, with a density of 1,500 Kg/m3.Its particle distribution can be well described by:
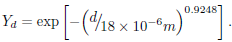 | (15) |
Figure 10 presents the good adjust of data, obtaining a coefficient of determination of R2=0.9707.
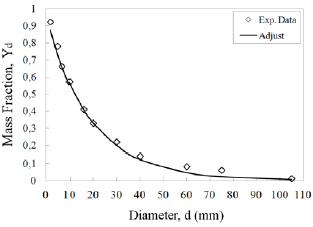
Figure 10: Rosin-Rammler function adjustement for the granulometric distribution
In Fig. 11 it is shown the solids influence on the pressure drop of the devices, where the lower values obtained are due to a decrease in peak velocity respect to those presented in Fig. 7. These results are consistent with those observed by Bernardo et al., (2006), and it represents an important feature of the fluid dynamics in cyclones knowing as free body flow. According to Cortés and Gil (2007), this decrease in velocity is due to the increase in the friction coefficient for the solids that occurs on the walls of the device, and depends on the concentration of particulate matter in the gas phase.
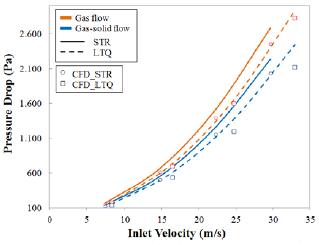
Figure 11: Total pressure drop for different inlet velocities in Stairmand and LTQ cyclones, with and without solid concentration
For the collection efficiency, a number of monodisperse particles were followed into the cyclone and were monitored the number that escaped through the bottom outlet. Figure 12 shows the numerically curves of particle collection efficiency obtained. It is noted that both designs have efficiencies higher than 97% for dp ≥ 10 μm. For smaller diameters and the same concentration of solids, LTQ cyclone always showed higher collection efficiency.
Figure 12: Gradual collection efficiency obtained for Stairmand and LTQ cyclones
To outline the trajectory of solids inside the devices, the cutting diameter of the distribution was used, i.e. dp50 ≥ 12 μm, and two paths were recreated with the stochastic method. Figures 13 and 14 show the trajectories of the particles inside Stairmand and LTQ cyclones respectively, released in different positions at the entrance. The time residence is greater for those injected into the higher regions, and the average value is slightly higher for LTQ cyclone (Stairmand average of 1.16 seconds and LTQ 1.29 seconds).
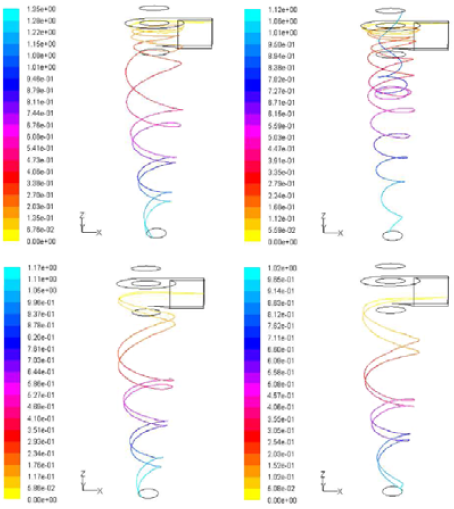
Figure 13: Time residence of particle trajectories for dp50=12μm in Stairmand cyclone, released from different regions in the entry surface. (Gas flow = 1.59 m3/s)
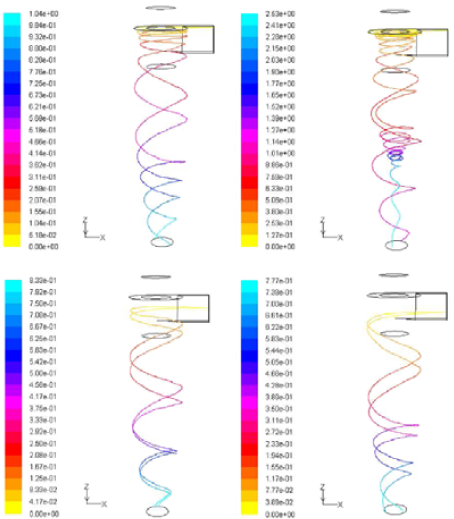
Figure 14: Time residence of particle trajectories for dp50=12μm in LTQ cyclone, released from different regions in the entry surface. (Gas flow = 1.59 m3/s)
The collection efficiency for particles varies with the position in which they enter into the cyclone. It is observed that the solids entering through the middle and lower region, collide with the walls of the cylindrical body of the device and travel to the exit of collected solids at the bottom without being seriously affected by the pressure and velocity fields inside. The only difference between the entry regions is the time taken by particles hitting the walls.
Due to the process requirements and that the simulated equipments are high-efficiency cyclones, the presented paths by the particles are mostly downwards. However, if the solids enter by the top inlet duct, there will be some particles -generally smaller-that will escape with the gas and the separation will be lower -punctual case is observed in Stairmand cyclone, Figure 13, second path-. For LTQ cyclone is observed that one of the particles entering the upper region has a circular motion in the central vortex, however, as the terminal velocities are lower and the pressure has stable values within the core, it separates from the gas flow and is collected. It should be noted that the Lagrangian stochastic model used does not consider the interaction between particles. In practice it is possible that particles with smaller diameters are collected or stagnate in the walls during the process. Also, if you are operating at high temperatures as in the cement industry, the solids may form permanent deposition and severely affect the performance of the cyclone.
V. CONCLUSIONS
The Reynolds Stress Model was used to simulate the anisotropic turbulent behavior in gas and gas-solid flows for two types of cyclones: Stairmand-H.E. and LTQ-H.E. It was verified its applicability by good qualitative relationship of pressure and velocities profiles compared with those cited in literature.
Parameters such as pressure drop and collection efficiency indicate that the proposed design (LTQ) can offer an alternative to reduce energy consumption in industrial plants, and generally improve the performance parameters of the separation process.
The concentration of solids in the gas stream plays an important role in the operation of the cyclone. Due to the increase of solids, greater efficiencies and lower pressure drops are obtained. Also, the simulation of two-phase flow in cyclones requires more progress, be-cause factors such as inter-particle events and conditions on the wall have not yet received the attention they deserve.
The results obtained to modeling both cyclones geometries in steady state conditions, are successful. However, it is necessary to use transient simulation methods with high accuracy in the numerical discretization to capture the full complexity of the gas flow within these devices and reasonably estimate phenomena still not predicted such as the natural length of the cyclone -and therefore, the recommended geometric length-, the circumstances and the effects of a loss of the vortex coherence and the resulting chaotic flow, the effect of swirl stabilization devices, among others. Obviously, more systematic research is required in this regard.
VI. NOMENCLATURE
a: Cyclone inlet height (m)
b: Cyclone inlet width (m)
B: Cyclone dust outlet diameter (m) CD:Drag coefficient
Ci: Solids concentration in the flow (g/m3)
D: Cyclone diameter (m)
De: Vortex finder diameter (m)
dp: Particle diameter (m)
dp50: Cutting diameter of particles that are collected with 50% efficiency (m)
 : Mean diameter (m)
FD: Drag force per unit of mass particles
g: Gravity acceleration (m/s2)
h: Cyclone cylinder height (m)
H: Total cyclone height (m)
k: Turbulent kinetic energy (J/Kg) Ln: Cyclone vortex length (m)
Ln: Cyclone vortex length (m)
m: Spread parameter in Rosin-Rammler distribution
P: Static pressure (Pa) Re: Reynolds number
S: Vortex finder length (m)  : Mean components of velocity (m/s)
u': Fluctuating components of velocity (m/s)
Vin: Inlet velocity (m/s)
Vt: Tangential component of fluid velocity in cyclone (m/s)
Vz: Axial component of fluid velocity in cyclone (m/s)
Yd: Mass fraction of particles with a diameter greater than dp (%)
Greek symbols
αi: Constants for smooth spherical particles
ΔP : Cyclone pressure drop (Pa)
: Dissipation rate of the turbulent kinetic energy (J/Kg.s)
η: Overall collection efficiency (%)
μ: Dynamic viscosity of the fluid (Kg/m.s)
μt: Turbulent viscosity (Kg/m.s)
ρ: Fluid density (Kg/m3)
ρp: Particle density (Kg/m3)
τij:Reynolds Stress tensor (Kg/m2.s)
REFERENCES
1. Bernardo, S., A.P. Peres and M. Mori, "Computational study of cyclone flow fluid dynamics using a different inlet section angle," Thermal Engineering, 4, 18-23 (2005).
2. Bernardo, S., M. Mori, A.P. Peres and R.P. Dionisio, "3D computational fluid dynamics for gas and gas-particle flows in a cyclone with different inlet section angles," Powder Technology, 162, 190-200 (2006).
3. Cortés, C. and A. Gil, "Modeling the gas and particle flow inside cyclone separators," Prog. Energy Combust. Sci., 33, 409-452 (2007).
4. Gimbun, J., T.G. Chuah, A. Fakhrul-Razi and T.S.Y. Choong, "The influence of temperature and inlet velocity on cyclone pressure drop: a CFD study," Chem. Eng. & Process, 44, 7-12 (2005).
5. Hoffmann, A.C. and E.S. Louis, Gas cyclones and swirl tubes: Principles, design and operation, Springer, New York (2004).
6. Koch, W. and W. Licht, "New design approach boosts cyclone efficiency," Chemical Engineering, 84, 241-249 (1977).
7. Lee, J.W., J.Y. Hoe and D.Y. Lee, "Effect of the cylinder shape of a long-coned cyclone on the stable flow-field establishment," Powder Technology, 165, 30-38 (2006).
8. López, G.M., D.A. Trujillo and G.C. Quintana, "Nueva propuesta para el análisis y la selección de ciclones," Ing. Qca., Uruguay, 27, 4-12 (2005).
9. Martignoni, W.P., S. Bernardo and C.L. Quintani, "Evaluation of cyclone geometry and its influence on performance parameters by computational fluid dynamics (CFD)," Brazilian Journal of Chemical Engineering, 24, 83-94 (2007).
10. Morsi, S.A. and A.J. Alexander, "An investigation of particle trajectories in two-phase flow systems," Journal of Fluid Mechanics, 55, 193-208 (1972).
11. Narasimha, M., M.S. Brennan, P.N. Holtham and T.J. Napier-Munn, "A Comprehensive CFD model of dense medium cyclone performance," Miner. Eng., 20, 414-426 (2007).
12. Patankar, S., Numerical heat transfer and fluid flow. Taylor & Francis, United States (1980).
13. Peres, A.P., Tecnicas de fluidodinamica computacional aplicadas a escoamentos em ciclones, PhD Thesis, Campinas State University -UNICAMP-(2002).
14. Ranade, V., Computational flow modeling for chemical reactor engineering. Elsevier Science & Technology, San Diego, CA (2001).
15. Wang, B., D.L. Xu, K.W. Chu and A.B. Yu, "Numerical study of gas-solid flow in a cyclone separator," App. Math. Model., 30, 1326-1342 (2006).
16. Witt, P.J., L.J. Mittoni, J. Wu and I.C. Shepherd, "Validation of a CFD model for predicting gas flow in a cyclone," CHEMECA99, Australia, 26-29 (1999).
17. Xiang, R.B. and K.W. Lee,"Numerical study of flow field in cyclone of different height," Chem. Eng. & Proc., 44, 877-883 (2005).
18. Zhao, B., H. Shen and Y. Kang, "Development of a symmetrical spiral inlet to improve cyclone separator performance," Powder Technology, 145, 47-50 (2004).
Received: November 27, 2011.
Accepted: April 26, 2012.
Recommended by Subject Editor Eduardo Dvorkin.
