


Servicios Personalizados
Articulo
 pdf en Inglés
 Articulo en XML
 Referencias del artículo
 Permalink
Latin American applied research
versión On-line ISSN 1851-8796
Lat. Am. appl. res. vol.43 no.4 Bahía Blanca oct. 2013
Tuantum chemical investigations of new conjugated compounds based on dithiobithiophene as solar cells materials
Y.A. Sadiki†, M. Hamidi‡, S.M. Bouzzine‡,§, L. Bejjit†,& , M. Haddad† and M. Bouachrine†,& *
^rND^1A01^nM^sBijedic^rND^1A02^nN^sNeimarlija^rND^1A01^nM^sBijedic^rND^1A02^nN^sNeimarlija^rND^1A01^nM^sBijedic^rND^1A02^nN^sNeimarlijaSpeed of sound as a source of accurate thermodynamic properties of gases.
M. Bijedic† and N. Neimarlija‡
† Faculty of Technology, University of Tuzla, 75000 Tuzla, Bosnia and Herzegovina. muhamed.bijedic@untz.ba
‡ Faculty of Mechanical Engineering, University of Zenica, 72000 Zenica, Bosnia and Herzegovina. nagibn@mf.unze.ba
Abstract— A procedure for deriving thermodynamic properties of gases (the compression factor, the specific heat capacity at constant volume, and the specific heat capacity at constant pressure) from the speed of sound is presented. It is based on numerical integration of differential equations connecting the speed of sound with other thermodynamic properties. The set of differential equations is solved as the initial-boundary-value problem. The initial values of the compression factor and the specific heat capacity at constant volume are specified along the isochore in the perfect-gas limit, while the boundary values of the compression factor are specified along two isotherms at the lowest temperatures of the range. The procedure is tested on methane, ethane, and carbon dioxide. The average absolute deviations of the compression factor, the specific heat capacity at constant volume, and the specific heat capacity at constant pressure, from respective reference values, are 0.0001%, 0.004%, and 0.008%, respectively.
Keywords— Speed of Sound; Compression Factor; Heat Capacity; Gases.
I. INTRODUCTION
Knowledge of thermodynamic properties of fluids appearing in chemical industry is of crucial importance for analysis of processes and for design of process equipment. For some substances these properties are not available at all (e.g., newly synthesized compounds), for some they are available only in limited range of pressure and/or temperature (e.g., at atmospheric pressure and surrounding temperature), while for some reliability of these properties is questionable (e.g., high uncertainty of measurement). Traditionally, the engineers and scientists have been using tables and charts from various handbooks as the main source of such data. However, when one decides to make its own compilation, the discrepancies among different sources may become obvious. In such situation the decision may be difficult. Besides, tabulated data are rather inappropriate for big scale calculations involving digital computers (e.g., Computer Aided Design, Computational Fluid Dynamics). For this purpose the equations of state are more appropriate.
Van der Waals was the first who posed the equation of state which took into account influence of intermolecular forces in gases under elevated pressures (van der Waals, 1873). Since that, literally hundreds of various modifications of his equation have appeared. Although some of these equations of state have accuracy which satisfies majority of technical and scientific applications (Span, 2000), a vast majority of them fail to represent thermodynamic properties of substances for which they are designed (not only thermal but caloric as well) with uncertainties not exceeding those of direct measurements. Only equations in reference quality (e.g., reference or fundamental equations of state) may represent thermodynamic surface (including critical region) as reliably as direct measurement. Unfortunately, only a few of such equations of state have been developed to date (e.g., for argon (Tegeler et al., 1999), nitrogen (Span et al., 2000), carbon dioxide (Span and Wagner, 1996), water (Wagner and Pruss, 2002), methane (Setzmann and Wagner, 1991) and ethylene (Smukala et al., 2000)).
Generally, the caloric properties are measured with the uncertainties which are several orders of magnitude higher than those of the thermal properties. The situation is especially critical with the heat capacity (e.g., both isobaric and isochoric) (Younglove, 1974; Bier et al., 1976; and Ernst et al., 1989), since this property is very important when the full thermodynamic equation of state (e.g., both thermal and caloric) is designed. Fortunately, there is one exception to this rule - the speed of sound. Advances in measurement of this caloric property in the last several decades made this property very attractive source of other thermodynamic properties. These thermodynamic properties may be derived from the speed of sound with accuracy exceeding that of respective direct measurements. Nowadays, the speed of sound is measured with outstanding accuracy (Trusler and Zarari, 1992; Estrada-Alexanders and Trusler, 1997; and Estrada-Alexanders and Trusler, 1998), even exceeding that of the thermal properties (Pieperbeck et al., 1991; Funke et al., 2002; and Klimeck et al., 2001). Thanking to this fact, this caloric property is used in the design of the reference equation of state in its final stage, that is, for fine adjustment of the equation parameters (Schmidt and Wagner, 1985; Setzmann and Wagner, 1989; and Span and Wagner, 2003). However, the thermodynamic properties may also be derived from the speed of sound directly. Unfortunately, the speed of sound is connected to other thermodynamic properties through the set of partial differential equations whose general solution has not been found yet. The only exception is a part of the thermodynamic surface comprising the region of dilute gases at low pressures where analytical solution may be obtained from the model of intermolecular potential energy (Maitland and Smith, 1973; Trusler et al., 1997; and Estela-Uribe and Trusler, 2000). However, if higher pressures are considered the numerical integration (Estrada-Alexanders et al., 1995), the finite differences (Estrada-Alexanders and Justo, 2004), and the recursive equations (Lago and Giuliano Albo, 2008) are among the methods worth of attention.
II. THEORY
Isaac Newton was the first who posed the problem of theoretical calculation of the speed of sound in fluids. However, his formula (Newton, 1687)
 | (1) |
where u is the speed of sound, p is the pressure, and r is the density, implied isothermal rather than adiabatic propagation of sound. Pierre Simon Laplace explained adiabatic nature of a sound wave and corrected Newton's formula to obtain the final solution (Laplace, 1816)
 | (2) |
where cp is the specific heat capacity at constant pressure and cv is the specific heat capacity at constant volume. Since acoustic wave propagates adiabatically, an adiabate of a perfect gas in pressure - density coordinates is given by relationship of the form
 | (3) |
where k is the ratio of the heat capacities at constant pressure and volume (cp/cv). Now, general expression (3) may be written in a more specific form
 | (4) |
where p and r are the instantaneous pressure and density at any point, while p0 and r0 are equilibrium pressure and density of the fluid (Benedetto et al., 1999). If one differentiates Eq. (4) with respect to r (bearing in mind that p0 and r0 are constants because they have uniform values throughout the fluid), fundamental relation between the speed of sound and macroscopic thermodynamic properties of a fluid is obtained (Trusler, 1991)
 | (5) |
where S denotes entropy. This expression is exact in the limits of small amplitude and low frequency. The former limit can always be achieved while the latter is usually, but not always, approached in practice. Because of that, a practical measurement of the speed of sound is corrected to the zero-frequency limit.
While expression (5) is one of the fundamental thermodynamic relations, it is inconvenient for use because of the isentropic partial derivative. If temperature and pressure are taken as the independent variables, Eq. (5) may be written in a more convenient form
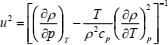 | (6) |
where T is the temperature. When temperature and density are taken as the independent variables the following expression is obtained
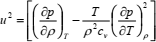 | (7) |
In either case, auxiliary equations will be necessary because not only density, but also the heat capacities are unknown. For that reason, Eqs. (6) and (7) are usually coupled with the thermodynamic relations (Sychev, 1983)
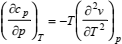 | (8) |
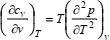 | (9) |
respectively. If density is eliminated from Eq. (7) and specific volume from Eq. (9), in favor of a more slowly varying compression factor, the following set of partial differential equations is obtained:
 | (10) |
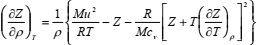
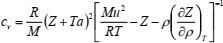 | (11) |
 | (12) |
where Z = Mp/(ρRT) is the compression factor, R is the universal gas constant, and M is the molar mass. The set of Eqs. (10) to (12) may be solved numerically in the range of ρ and T in which accurate speed of sound values are available. This set of equations may be solved as the initial-value problem (IVP) for the set of ordinary differential equations if density derivatives (∂Z/∂ρ)T and (∂cv/∂ρ)T are known. Initial values of Z and a are specified along the isotherm at the lowest temperature of the range (Estrada-Alexanders et al., 1995).
The main disadvantage of the IVP method is its requirement not only for the Dirichlet, but also for the Neumann boundary conditions. For these later, to be determined with sufficient accuracy for the results to equal or exceed the accuracy of direct measurements, values of Z specified along two closely spaced isotherms should be sufficient but, for monatomic gases, several isotherms may be needed (Estrada-Alexanders et al., 1995). One way to avoid the Neumann boundary conditions is to specify several values of Z along two isotherms and two isochores surrounding the area of interest (Estrada-Alexanders and Justo, 2004).
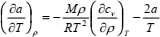
If Eqs. (11) and (12) are solved for (∂Z/∂ρ)T and (∂cv/∂ρ)T, respectively, bearing in mind Eq. (10), the following set of partial differential equations is obtained:
 | (13) |
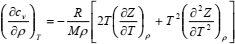 | (14) |
The set of Eqs. (13) and (14) may be solved numerically as the initial-boundary-value problem (IBVP) for the set of ordinary differential equations if temperature derivatives (∂Z/∂T)ρ and (∂2Z/∂T2)ρ are known. Initial values of Z and cv are specified along the isochore at the lowest density of the range.
If the lowest density of the range is in the perfect-gas limit, then Zpg = 1, and (Goodwin and Trusler, 2003)
 | (15) |
Therefore, in the IBVP method, initial values of Z and cv are obtained from the perfect-gas law and speed of sound measurements (extrapolated to the zero-pressure). Theoretically, these initial values should be sufficient to obtain particular solution of Eqs. (13) and (14) if accurate temperature derivatives (∂Z/∂T)ρ and (∂2Z/∂T2)ρ are available. However, this requirement is difficult to meet in practice, especially at the terminal temperature(s) of the range. For that reason boundary values of Z are specified along two isotherms at the lowest temperatures of the range.
Having calculated cv in either way, in the density and temperature range of interest, the specific heat capacity at constant pressure may be obtained from (Sychev, 1983)
 | (16) |
When a function is given as a set of discrete data-points, whose analytical expression is not known, its derivative upon an independent variable(s) may not be calculated exactly but rather approximately. This approximate derivative (estimate) is usually obtained from an interpolation polynomial. However, since interpolation polynomial passes exactly through each data-point this approach may give satisfactory results only if data-points are smooth enough (e.g., do not oscillate much). Accuracy of derivatives estimated from an interpolation polynomial also depends on a number of data-points and on their distribution. Increasing a number of data-points (and order of a polynomial as well) accuracy of derivatives increases, but to some extent, and after that it decreases. If data-points are equally spaced in a whole range of an independent variable, derivative estimates in terminal points will be the worst (e.g., the Runge phenomenon). This can be reduced by clustering data-points around the edges of a range (e.g., the Chebyshev nodes).
One of commonly used forms of an interpolation polynomial is that of Lagrange (Cheney and Kincaid, 1985). Its application in numerical interpolation and differentiation is particularly efficient if coupled with the barycentric interpolation formula. The first form of the barycentric interpolation formula is (Berrut and Trefethen, 2004)
 | (17) |
where
 | (18) |
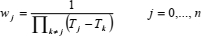
and the barycentric weights
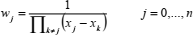 | (19) |
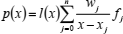
The second (e.g., true) form of the barycentric interpolation formula is (Berrut and Trefethen, 2004)
 | (20) |
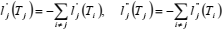
If compression factor Z is represented as a function of temperature T along any isochore, by a polynomial in Lagrange form,  , then the first and second derivatives of Z, with respect to T, are (Berrut and Trefethen, 2004):
 | (21) |
 | (22) |
 | (23) |
 | (24) |
The Chebyshev points of the second kind are given by (Berrut and Trefethen, 2004)
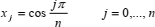 | (25) |
if the range of x is -1 to 1, or by
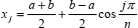 | (26) |
for an arbitrary range a to b.
III. RESULTS AND DISCUSSION
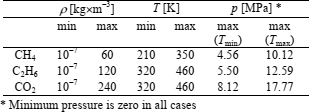
The IBVP method is tested on methane, ethane, and carbon dioxide. Density, temperature and pressure ranges considered are given in Table 1. The density ranges are divided into 7 equally spaced isochores, while the temperature ranges are divided into 15 isotherms distributed according to the Chebyshev points of the second kind
Table 1. ρ-T-p ranges considered
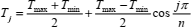 | (27) |
where n = 14. However, sound-speed is measured along isotherms at different pressures rather than densities. For that reason, 90 pressure data-points (6 isochores x 15 isotherms) are estimated from the Peng-Robinson equation of state (Peng and Robinson, 1976), and sound-speed values for methane (Setzmann and Wagner, 1991; and Trusler and Zarari, 1992), ethane (Estrada-Alexanders and Trusler, 1997; and Friend et al., 1991), and carbon dioxide (Span and Wagner, 1996; and Estrada-Alexanders and Trusler, 1998) are specified at these points. Since pressures are obtained from the compression factors at each integration step, sound-speed values between these base points are interpolated with respect to pressure according to
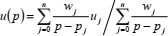 | (28) |
where
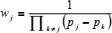 | (29) |
The remaining 15 pressure data-points at the lowest density have zero value. Besides, 12 compression factor data-points (plus two data-points in the perfect-gas limit) are required to impose the boundary conditions along two isotherms at the lowest temperatures of the range. According to Table 1, temperature interval considered is 140 K in all cases. When Eq. (27) is applied, two isotherms at the lowest (and the highest) temperatures are spaced at about 2 K.
Temperature derivatives of compression factor are estimated from Eqs. (21) to (24). For the first 8 isotherms polynomial of the 7th degree is used, and for the last 7 isotherms polynomial of the 14th degree (e.g., the first isotherm is the one at the lowest temperature). In this way the best results are obtained.
Numerical integration was conducted using the Runge-Kutta-Verner fifth-order and sixth-order method with adaptive step-size (Hull et al., 1976).
Deviations of the results obtained, from respective reference data for methane (Younglove, 1974; Pieperbeck et al., 1991; Setzmann and Wagner, 1991; and Klimeck et al., 2001), ethane (Michels et al., 1954; Bier et al., 1976; Douslin and Harrison, 1973; and Friend et al., 1991), and carbon dioxide (Ernst et al., 1989; Klimeck et al., 2001; and Span and Wagner, 1996) are given in Tables 2 to 5. Uncertainties of reference data used are given in Table 6.
Table 2. Maximum relative deviation (IBVP method)
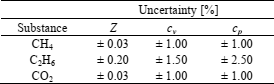
Table 3. Absolute average deviation (IBVP method)
Table 4. Maximum relative deviation (IVP method).
Table 5. Absolute average deviation (IVP method).
Table 6. Uncertainties of reference data used.
The relative deviation of respective quantities is calculated according to
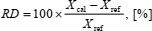 | (30) |
where Xcal is calculated value and Xref is reference value of Z, cv, and cp. The absolute average deviation of the compression factor is calculated according to
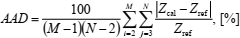 | (31) |
and that of the heat capacities according to
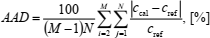 | (32) |
where M is total number of isochores (e.g., 7), and N is total number of isotherms (e.g., 15) in the ranges considered. Since the initial values of the compression factor and the heat capacity are specified along the lowest isochore it is omitted in Eqs. (31) and (32). Similarly, the boundary values of the compression factor are specified along two isotherms at the lowest temperatures and because of that these isotherms are omitted in Eq. (31). Therefore, total number of the compression factor data-points is (7-1) ' (15-2) = 78, and that of the heat capacities (7-1) ' 15 = 90.
Generally, it is clear that the IBVP method gives much better results than the IVP method (two orders of magnitude in average), for the same set of initial/boundary conditions. There are only two ways for improving the results of the IVP method - by narrowing spacing between the first two isotherms or by specifying initial values of Z at additional temperature(s). It is established that the IVP method may give similar results as the IBVP method only when spacing between the first two isotherms is two times of magnitude smaller (e.g., 0.02 K). Comparing figures from Table (3) to those from Table (6) it arises that values of AAD are two to three times of magnitude smaller than corresponding values of uncertainty of reference data. Therefore, uncertainty of the results obtained is virtually the same as that of reference data used.
IV. CONCLUSIONS
The method of the initial-boundary-value problem is recommended for deriving the thermodynamic properties of gases from the speed of sound. The initial values (several data-points of Z and cv) are specified along the isochore in the perfect-gas limit. These data may be obtained directly from the perfect-gas law and speed of sound measurements (extrapolated to the zero-pressure). The boundary conditions (several data-points of Z) are specified along two isotherms at the lowest temperatures of the range. It is the least demanding method to date because it requires just a few thermal data-points (e.g., Z, r, v) from other source. Besides, no Neumann boundary conditions are required. The results obtained show excellent agreement with respective reference data.
REFERENCES
1. Benedetto, G., R.M. Gavioso and R. Spagnolo, "Precision measurements of the speed of sound and thermodynamic properties of gases," Rivista Del Nuovo Cimento, 22, 1-42 (1999).
2. Berrut, J.-P. and L.N. Trefethen, "Barycentric Lagrange interpolation," SIAM Rev., 46, 501-517 (2004).
3. Bier, K., J. Kunze and G. Maurer, "Thermodynamic properties of ethane from calorimetric measurements," J. Chem. Thermodynamics, 8, 857-868 (1976).
4. Cheney, W. and D. Kincaid, Numerical Mathematics and Computing, Brooks/Cole Publishing Company, Pacific Grove (1985).
5. Douslin, D.R. and R.H. Harrison, "Pressure, volume, temperature relations of ethane," J. Chem. Thermodynamics, 5, 491-512 (1973).
6. Ernst, G., G. Maurer and E. Wiederuh, "Flow calorimeter for the accurate determination of the isobaric heat capacity at high pressures; Results for carbon dioxide," J. Chem. Thermodynamics, 21, 53-65 (1989).
7. Estela-Uribe, J.F. and J.P.M. Trusler, "Acoustic and volumetric virial coefficients of nitrogen," Int. J. Thermophys., 21, 1033-1044 (2000).
8. Estrada-Alexanders, A.F., J.P.M. Trusler and M.P. Zarari, "Determination of thermodynamic properties from the speed of sound," Int. J. Thermophys., 16, 663-673 (1995).
9. Estrada-Alexanders, A.F. and J.P.M. Trusler, "The speed of sound and derived thermodynamic properties of ethane at temperatures between 220 K and 450 K and pressures up to 10.5 MPa," J. Chem. Thermodynamics, 29, 991-1015 (1997).
10. Estrada-Alexanders, A.F. and J.P.M. Trusler, "Speed of sound in carbon dioxide at temperatures between (220 and 450) K and pressures up to 14 MPa," J. Chem. Thermodynamics, 30, 1589-1601 (1998).
11. Estrada-Alexanders, A.F. and D. Justo, "New method for deriving accurate thermodynamic properties from speed-of-sound," J. Chem. Thermodynamics, 36, 419-429 (2004).
12. Friend, D.G., H. Ingham and J.F. Ely, "Thermophysical properties of ethane," J. Phys. Chem. Ref. Data, 20, 275-347 (1991).
13. Funke, M., R. Kleinrahm and W. Wagner, "Measurements and correlation of the (p,r,T) relation of ethane. I. The homogeneous gas and liquid regions in the temperature range from 95 K to 340 K at ressures up to 12 MPa," J. Chem. Thermodynamics, 34, 2001-2015 (2002).
14. Goodwin, A.R.H. and J.P.M. Trusler, Speed of Sound, in: Measurement of the Thermodynamic Properties of Single Phases (Eds. Goodwin, A.R.H., K.N. Marsh and W.A. Wakeham), Elsevier, Amsterdam (2003).
15. Hull, T.E., W.H. Enright and K.R. Jackson, User's Guide for DVERK - A Subroutine for Solving Non-Stiff ODEs, Technical Report 100, University of Toronto, Toronto (1976).
16. Klimeck, J., R. Kleinrahm and W. Wagner, "Measurements of the (p,r,T) relation of methane and carbon dioxide in the temperature range 240 K to 520 K at pressures up to 30 MPa using a new accurate ingle-sinker densitometer," J. Chem. Thermodynamics, 33, 251-267 (2001).
17. Lago, S. and P.A. Giuliano Albo, "A new method to calculate the thermodynamic properties of liquids from accurate speed-of-sound measurements," J. Chem. Thermodynamics, 40, 1558-1564 (2008).
18. Laplace, P.-S., "On the speed of sound in the air and water," Ann. de Chim. et de Phys., 3, 238-241 (1816).
19. Maitland, G.C. and E.B. Smith, "A simplified representation of intermolecular potential energy," Chem. Phys. Letters, 22, 443-446 (1973).
20. Michels, A., W. Van Straaten and J. Dawson, "Isotherms and thermodynamical functions of ethane at temperatures between 0°C and 150°C and pressures up to 200 atm," Physica, 20, 17-23 (1954).
21. Newton, I., The Mathematical Principles of Natural Philosophy, (1687).
22. Peng, D.Y. and D.B. Robinson, "A new two-constant equation of state," Ind. Eng. Chem. Fund., 15, 59-64 (1976).
23. Pieperbeck, N., R. Kleinrahm, W. Wagner and M. Jaeschke, "Results of (pressure, density, temperature) measurements on methane and on nitrogen in the temperature range from 273.15 K to 323.15 K at pressures up to 12 MPa sing a new apparatus for accurate gas-density measurements," J. Chem. Thermodynamics, 23, 175-194 (1991).
24. Schmidt, R. and W. Wagner, "A new form of the equation of state for pure substances and its application to oxygen," Fluid Phase Equil., 19, 175-200 (1985).
25. Setzmann, U. and W. Wagner, "A new method for optimizing the structure of thermodynamic correlation equations," Int. J. Thermophys., 10, 1103-1126 (1989).
26. Setzmann, U. and W. Wagner, "A new equation of state and tables of thermodynamic properties for methane covering the range from the melting line to 625 K and pressures up to 1000 MPa," J. Phys. Chem. Ref. Data, 0, 1061-1155 (1991).
27. Smukala, J., R. Span and W. Wagner, "A new equation of state for ethylene covering the fluid region for temperatures from the melting line to 450 K at pressures up to 300 MPa," J. Phys. Chem. Ref. Data, 29, 1053-1121 (2000).
28. Span, R., Multiparameter Equations of State - An Accurate Source of Thermodynamic Property Data, Springer-Verlag, Berlin (2000).
29. Span, R. and W. Wagner, "A new equation of state for carbon dioxide covering the fluid region for temperature from the triple-point temperature to 1100 K at pressures up to 800 MPa," J. Phys. Chem. Ref. Data, 25 , 1509-1596 (1996).
30. Span, R., E.W. Lemmon, R.T. Jacobsen, W. Wagner and A. Yokozeki, "A reference equation of state for the thermodynamic properties of nitrogen for temperatures from 63.151 to 1000 K and pressures to 2200 MPa," J. Phys. Chem. Ref. Data, 29, 1361-1433 (2000).
31. Span, R. and W. Wagner, "Equations of state for technical applications. I. Simultaneously optimized functional forms for nonpolar and polar fluids," Int. J. Thermophys., 24, 1-39 (2003).
32. Sychev, V.V., The Differential Equations of Thermodynamics, Mir Publishers, Moscow (1983).
33. Tegeler, C., R. Span and W. Wagner, "A new equation of state for argon covering the fluid region for temperature from the melting line to 700 K at pressures up to 1000 MPa," J. Phys. Chem. Ref. Data, 28, 779-850 (1999).
34. Trusler, J.P.M., Physical Acoustics and Metrology of Fluids, Adam Hilger, Bristol (1991).
35. Trusler, J.P.M. and M. Zarari, "The speed of sound and derived thermodynamic properties of methane at temperatures between 275 K and 375 K and pressures up to 10 MPa," J. Chem. Thermodynamics, 24, 973-991 (1992).
36. Trusler, J.P.M., W.A. Wakeham and M.P. Zarari, "Model intermolecular potentials and virial coefficients determined from the speed of sound," Molecular Physics, 90, 695-703 (1997).
37. Van der Waals, J.D., On the Continuity of the Gas and Liquid State, Ph. D. thesis, Leiden (1873).
38. Wagner, W. and A. Pruss, "The IAPWS formulation 1995 for the thermodynamic properties of ordinary water substance for general and scientific use," J. Phys. Chem. Ref. Data, 31, 387-535 (2002).
39. Younglove, B.A., "The specific heats cp and cv of compressed and liquefied methane," J. Res. Natl. Bur. Stand., 78, 401-410 (1974).
Received: August 28, 2012
Accepted: March 20, 2013.
Recommended by Subject Editor: Pedro de Alcântara Pessôa.
Reduction of ethanol emissions using manganese oxides supported metallic monoliths: A pilot-scale plant study.
M.A. Peluso†, J.E. SambetH†, and H. Thomas‡
† Centro de Investigación y Desarrollo en Ciencias Aplicadas (CINDECA), La Plata, 1900, Argentina. apelu@quimica.unlp.edu.ar
‡ PlaPiMu (CICPBA-UNLP), M.B. Gonnet, Argentina.
Abstract— Metallic monoliths were prepared by anodized aluminum-scale pilot plant, using sulfuric acid as electrolyte. Anodisation tests were conducted at different times and different temperatures of the electrolytic bath. Aluminum monolith anodized at 40°C for 30 min was selected for catalysts support. The monoliths were impregnated by two methods: i) impregnation in two stages using two Mn salts in an aqueous medium, and ii) impregnation using a KMnO4 solution in acetone. The last monolith presented a higher and a more homogeneous deposit of manganese oxide layer. The catalytic activity was tested in the total oxidation reaction of ethanol in a pilot-scale reactor at 50 L min-1, and ethanol concentrations of 900, 1800 and 3600 ppm. Monolith impregnated using acetone solution was more active that prepared in aqueous solution in all the experiments carried out.
Keywords— MnOx; Pilot-scale plant; metallic monoliths; VOCs.
I. INTRODUCTION
Volatile organic compound (VOCs) emissions, produced from industrial processes, mobile sources, etc., are considered to be severe air pollutants. Catalytic oxidation is one of the most attractive routes for the elimination of VOC emissions. Noble metals (Pt, Pd) or transition metal based-oxides (Mn, Cu, Co, Fe, Ni) are commonly used as active phases (Alifanti et al., 2005; Luo et al., 2007; Peluso et al., 2008a). Metal oxides have lower activity than noble metal catalysts but they are cheaper and have greater resistance to some poisons (Avila et al., 2005). Among the transition metal oxides of interest for VOC oxidation, MnOx-based materials exhibited great potential (Craciun et al., 2003).
For environmental applications, high flow rates should be treated and a low-pressure drop is required. For that reason, the catalytic system most widely used for catalytic VOC oxidation is the monolithic reactor.
Metallic monoliths present higher mechanical resistance and thermal conductivity, thinner walls and lower pressure drop than those in ceramics. Additionally, metallic substrates are produced easily and in different and complicated forms adapted to a wide variety of uses (Twing and Webster, 1998).
Aluminum monoliths are generally produced by anodic oxidation, in which a porous alumina layer is obtained on the aluminum surface. The alumina texture can be controlled modifying anodisation parameters such as the current density and the temperature (Burgos et al., 2002). These authors deposited Pt over 6 cm3 volume Al2O3/Al monoliths to study the combustion of VOCs. Barrio et al. (2005) studied the impregnation of Al2O3/Al monoliths at lab scale with KMnO4 using acetone and water as solvent. They found that pore sealing of alumina occurs in water solutions. However, this is prevented by the use of acetone.
A pilot-scale plant is used to test catalyst at operating conditions similar to the ones existing in to real gas turbine burners. Some works at pilot-scale plant are found using ceramic monoliths (Alvarez et al., 2002; Requies et al., 2008) but no metallic ones.
The aim of this work is to study the anodisation parameters to obtain metallic monoliths at higher dimensions than are usually found in lab scales, in order to prepare active catalysts for VOC oxidation with no-noble additives such as MnOx. The prepared monoliths were tested in a pilot-scale plant using catalytic oxidation of ethanol as test reaction.
II. METHODS
A. Sample Preparation
Cylindrical monolith supports were prepared by anodisation of 120 cm x 5 cm aluminum foils of 100 mm thick. Each foil was first washed with water and degreased with acetone. Anodisation was carried out in a longitudinal glass tank with 2.55M sulphuric acid, which is placed in second glass tank contained water. All the experiments were carried out with a current density of 4 A dm-2 and during 30 min. The electrolyte temperature used was 20, 30 and 40 °C. The aluminum sheet was fixed to the anode (working anode) between two aluminum foils connected to the cathode (counterelectrodes). The distance between electrodes was 5 cm. Agitation was provided by a pump which recirculates the electrolyte inside the bath. Temperature control of +/- 0.5°C was obtained with a refrigerating system and an electrical heater with an On-Off temperature controller. After anodising, aluminum foils were removed from the electrolytic bath, thoroughly washed with water to remove the acid, and then dried at 100 °C for 1h. Flat and corrugated foils were anodized separately and then both sheets were rolled together to form monoliths. Once the monoliths were prepared, they were calcined at 500 °C for 2h. Final monoliths were cylindrical of 5 cm high, and 4.5 cm in diameter and a geometrical volume of 79.5 cm3, and a cell density of 90 cpsi.
Two different catalytic monoliths were prepared. The first one was prepared by a two-step impregnation method, according to Peluso et al. (2008a). Monolith was wet impregnated in a KMnO4 solution, stirred for 60 min and dried. Then it was impregnated with a Mn(NO3)2 solution, stirred for 60 min and dried again. Finally, it was calcined at 500°C for 2 h. This monolith was called MnOx(aq)/Al (MnOx deposited on Al monolith from aqueous solution). In the other preparation the monolith was introduced in acetone and solid KMnO4 was added in order to obtain a 0.66 M solution. The solution with the monolith was stirred for 60 min. Then, the monolith was dried, and finally calcined in air at 500 °C for 2 h. This monolith was called MnOx(org)/Al (MnOx deposited on Al monolith from organic solution).
B. Characterization
The amount of alumina generated during anodisation was determined by gravimetry (accuracy better than 3%). It was calculated from the weight difference between the anodised aluminium sheets before and after chemical treatment that selectively dissolved the alumina. The dissolving solution contained 35ml of phosphoric acid and 20g of chromic acid dissolved in distilled water to 1 liter. The dissolution process was carried out at 80 °C for 10 minutes (Lizarbe Ruiz, 1984).
Taking into account the monoliths dimensions, the characterization of the prepared manganese loading monoliths were carried out using small pieces of crushed monoliths.
Textural properties of the monoliths were measured by N2 adsorption at the liquid nitrogen temperature (77 K) in a Micromeritics Accussorb 2100 D sorptometer using Surface micrographs of the monoliths and elemental composition and distribution were measured by EDS-SEM using a Phillips SEM 505 microscope. Phase composition was studied by XRD using a Phillips PW 1390 diffractometer with Ni-filtered Cu Ka radiation. X-ray photoelectron spectra (XPS) of the compounds were obtained using a multi-technique system (SPECS) equipped with a dual Mg/Al X-ray source and a hemispherical PHOIBOS 150 analyzer operating in the fixed analyzer transmission (FAT) mode. Binding energies (BE: +-0.1 eV) were calculated using the adventitious hydrocarbon (C (1s) = 284.6 eV) as the internal reference.
C. Catalytic activity
A pilot scale plant was used in order to test the catalysts at operating conditions similar to those existing in real burners. Ethanol was chosen to represent VOC, as it is a typical contaminant of fermentation, liquors and wine industries. Catalytic test was carried out at atmospheric pressure in a continuous tubular stainless steel reactor (Fig. 1) of 150 cm high and 4.5 cm in inner diameter and placed inside a heating furnace that is controlled by 5 independent electrical heaters.
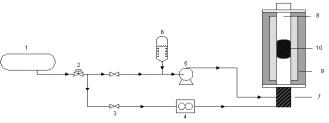
Fig.1- Experimental set-up used for the catalytic ethanol oxidation experiments. (1) Air from compressor; (2) control valves; (3) switch valves; (4) mass flow controller; (5) pump; (6) ethanol reservoir; (7) pre-heater; (8) reactor; (9) furnace; (10) monolith.
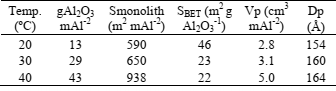
Table 1: Textural properties of prepared alumina.
Two monoliths were placed on an inert alumina packed bed of 50 cm in height which is used to preheat the gas stream. Temperature was measured using K type thermocouples in the center of the inlet face of the monoliths and in five zones of the furnace inner wall (set point for temperature control). Air from a compressor was mixed with the VOC stream that was evaporated by heating. Total gas flow of ethanol-air was 50000 cm3 min-1 (GSVH 19000 h-1) and the working temperatures were between 100 and 500 °C. The feed composition was 900, 1800 and 3600 ppm of ethanol in air, with an excess of O2. Under such conditions, reactor without monolith showed no activity. Conversion was calculated by measuring ethanol disappearance by Gas Chromatography (Shimadzu GC9A), together with the CO2 measurement by an on-line IR detector (Telaire T6613). Prior to reaction tests, catalysts were pre-treated in air at 500 °C for 1 hour.
III. RESULTS AND DISCUSSION
A. Monoliths Characterization
The influence of anodisation temperature on the amount of alumina generated by anodisation is shown in Table 1. The amount of alumina electro-generated and the specific surface of the monoliths increased when temperature was increased from 20 to 40 oC. However, the specific surface of the alumina decreased when electrolyte temperature was increased. This decrease was attributed to the decrease in the surface pore density, since the pore diameter and the total pore volume increased. Even if the specific surface area of the alumina decreased, this decrease was largely compensated by the increment of the generated alumina, resulting in an increment of the total alumina surface per square meter of aluminum.
Surface morphology of the materials was studied by SEM. Fig. 2(a) shows the surface of the raw material (aluminum sheet) as received from the manufacturer. The surface is smooth and straight. There was a drastic change in the surface roughness after the anodisation process. At 20 oC, the surface was completely covered by irregular slits with crests (Fig. 2(b)). As temperature increased from 20 to 40 oC, (Fig. 2 (c) and (d)) the same surface morphology was observed but at larger scale. This increase is parallel to the increase in the amount of generated alumina. As a consequence, monoliths were prepared with alumina anodized at 40 oC.
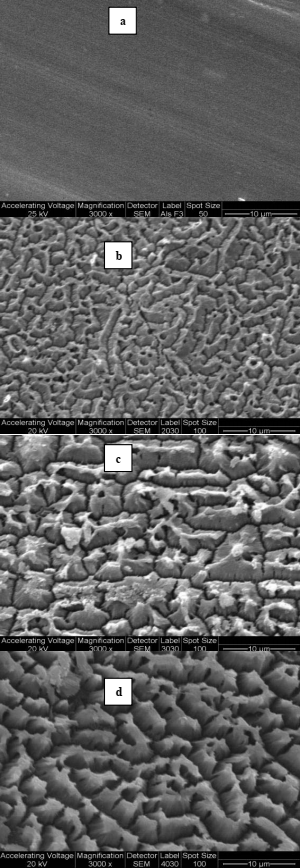
Fig. 2- SEM micrographs of the top view of Al2O3/Al prepared: (a) Al; (b) 20 oC; (c) 30 °C and (d) 40 °C.
The amount of manganese oxide loaded on the monolith was calculated by weight difference before and after preparation. The deposited amount was 0.65 g for the aqueous preparation and 1.03 g for the preparation with technical grade acetone. Monolith prepared in acetone presented homogeneous black color. Nevertheless, the monolith prepared in water showed a very heterogeneous dark brown to almost white color, presenting points where clearly manganese oxide accumulated (results not shown).
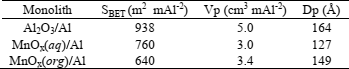
Textural properties of the parent and manganese loaded monoliths are shown in Table 2. After impregnation in water, there was a dramatic change in the textural properties of the monolith. In addition to the decreased specific area, a dramatic diminution of the pore volume and mean pore diameter is noted, indicating a narrowing of the pore mouth (Barrio et al., 2005) In the case of the monoliths prepared using acetone there is also a decrease in the textural properties. Nevertheless, the diminution in the pore volume and pore diameter is lower than that of the monoliths impregnated using aqueous solutions.
Table 2: Textural properties of monoliths.
Surface roughness of the monoliths impregnated with manganese was studied by SEM and elemental composition and distribution were studied by EDS. Results are shown in Table 3 and Fig. 3. Since monolith prepared in water showed a non homogeneous surface deposition, SEM and EDS analysis were performed in two zones of that monolith: brown and almost white zones. The study was also performed in two different zones of MnOx(org)/Al monolith. The brown zone of the MnOx(aq)/Al had an almost twice higher Mn concentration than the white zone, showing the non-homogeneous coating of the manganese layer. On the other hand, monolith MnOx(org)/Al presented a homogeneous surface with higher manganese concentration than the richest manganese zone of the MnOx(aq)/Al monolith. Potassium concentration was also higher in MnOx(org)/Al than in MnOx(aq)/Al. In addition, sulfur was present because of the use of H2SO4 during the anodization process.
Table 3: Chemical composition (wt %) from SEM-EDS analysis
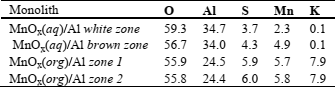
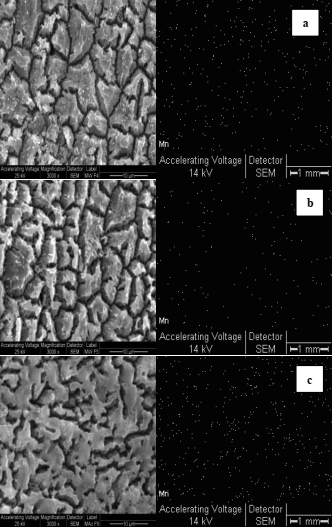
Fig. 3- SEM micrographs of the top view and Mn distribution of MnOx/Al2O3/Al monoliths: (a) MnOx(aq)/Al brown zone; (b) MnOx(aq)/Al white zone and (c) MnOx(org)/Al.
The higher K concentration of MnOx(org)/Al could be due on the one hand to the higher catalyst mass loaded and to the other hand to the fact that the soluble KNO3 formed in an aqueous medium was washed.
Mn distribution was uniform all along the sheet, being more populated in MnOx(org)/Al than in MnOx(aq)/Al in agreement with EDS analyses.
X-Ray diffraction patterns of monolith are shown in Fig. 4. Both monoliths show diffraction lines at 2q = 44.4 and 64.7° corresponding to metallic aluminum. Monolith prepared in aqueous medium shows diffraction lines at 2q = 24 and 38° characteristic of a-Mn2O3 and MnO2, respectively. On the other hand, MnOx(org)/ Al monolith presents a different pattern characterized by diffraction lines at 29 and 30° corresponding to mixed potassium and manganese oxides (KMnO2 and K3MnO4) and a line at 38° corresponding to MnO2.
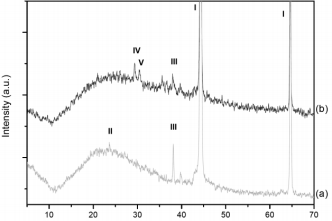
Fig.4- XRD patterns of MnOx/Al2O3/Al monoliths: (a) MnOx(aq)/Al, (b) MnOx(org)/Al. Lines: I = Al (04-0787); II = Mn2O3 (78-0390); III = MnO2 (72-1984); IV = KMnO2 (75-2171); V= K2SO4 (83-0682);
On the other hand, diffraction lines corresponding to sulfate such as K2S2O7, K2SO4, appeared in the MnOx(org)/Al monolith. These resulted from the anodisation in H2SO4.
As the produced manganese oxide phase was in small amounts and the manganese phases are usually non- stoichiometric, it was difficult to identify it only by means of XRD, therefore XPS studies were performed.
The oxidation state of the Mn species on the monolith surface was analyzed by XPS. Peak intensities were evaluated by applying the peak synthesis procedure (Ponce et al., 2000). As a general rule, when a metal or a metal oxide phase is deposited on a support surface, where it develops a strong metal (oxide)-support interaction, the binding energy of core-levels of the supported element (Mn 2p in this work) is shifted a few tenths of eV toward higher binding energies with respect to the bulk oxide (MnO2 or Mn2O3 here) (Cubeiro and Fierro, 1998).
XPS results are summarized in Table 4. In the XPS analyses of the MnOx(aq)/Al monolith, the Mn2p, O1s, C1s, Al2s and Al2p signals were recorded. The Mn2p3/2 is centered at 642.2 eV and deconvoluted in two peaks with BE around 641.8 and 643.1 which are in the range of that reported for Mn2O3 (641.3-641.8 eV) and Mn4+ ions, respectively (de la Peña O'Shea et al., 2004; Obalová et al., 2007). The O1s peak was composed by two components. The binding energy of 530.7 eV is characteristic of lattice oxygen (O2-) and the binding energy of 532.6 eV could be assigned to OH- species (Wang and Li, 2010).
Table 4: XPS results monoliths
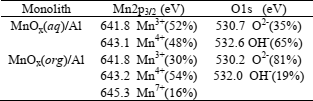
XPS analysis of MnOx(org)/Al monolith detected the presence of Mn2p, O1s, C1s, K2p, Al2s and Al2p signals. The deconvolution of the Mn2p3/2 electron binding energy peak (centered at 643.0 eV) included components centered at 641.8, 643.2 and 645.3 eV attributed to Mn3+, Mn4+ and Mn7+, respectively (Obalova et al., 2007; Wollner, 1993). This result is in according to Oku et al. (1999) who have reported that the Mn2p3/2 binding energy of KMnO4 is in the range of 645-646 eV. The presence of Mn7+ can be related to the detection of the K2p signal, pointing to an incomplete reaction. The O1s was split into two components at 530.2 and 532.0 eV, assigned to lattice oxygen and hydroxyl groups, respectively. The presence of Mn3+ and Mn4+ was also found in the XRD experiments. The presence of Mn7+ was only detected in XPS. This could be due to the fact that XRD is a bulk technique and XPS is a more superficial technique, and also manganese oxides are usually non-stoichiometric and present several oxidation states.
B. Catalytic activity
Catalytic tests were performed at a total flow of 50000 cm3 min-1, corresponding to a specific velocity of 162 cm seg-1and a Reynolds number of 402. This value is in agreement with those normally used in catalytic converters (Loayza Perez, 2003).
In all samples tested, CO2, H2O and acetaldehyde were formed during ethanol oxidation, and no other partial oxidation products were detected. Acetaldehyde was observed at conversion values below 40%. Preliminary experiments with two Al2O3/Al monoliths placed in the reactor did not show any activity for the oxidation of ethanol.
The catalytic activity at different ethanol concentrations are shown in Figs. 5 and 6 for MnOx(aq)/Al and MnOx(org)/Al monoliths, respectively. When increasing ethanol concentration from 900 to 1800 ppm, and from 1800 to 3600 ppm, catalytic activity decreased in both catalysts, being MnOx(org)/Al more active catalysts than MnOx(aq)/Al throughout all tests carried out with the same ethanol concentration. For the MnOx(org)/Al monolith there is a markedly dependence of ethanol concentrations when it is raised from 900 to 1800 ppm, with a difference in the T90 of about 40 °C. From 1800 to 3600 ppm, the ignition curves are somewhat similar, with a difference in the T90 of 9 °C.
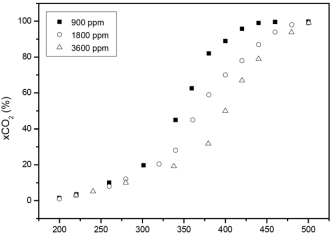
Fig. 5- Ignition curves of ethanol over MnOx(aq)/Al monolith at different ethanol concentrations.
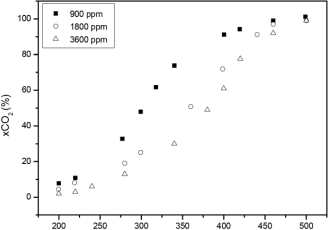
Fig. 6- Ignition curves of ethanol over MnOx(org)/Al monolith at different ethanol concentrations.
In both catalysts there is evidence of the presence of the pair Mn4+ - Mn3+, which is claimed to be related to the activity of manganese oxides (Peluso et al., 2008b).
On the other hand, potassium is claimed to be a very useful modifying alkali metal, which improves properties of various oxide catalysts (Chen and Zheng, 2004; Zhang et al., 2007).
Although the manganese oxide formed in both catalyst is not the same, the higher potassium and manganese oxide concentration, in addition to the more homogeneous distribution of the active phase made the MnOx(org)/Al monolith presents a higher ethanol conversion than MnOx(aq)/Al monolith.
MnOx/Al2O3/Al monoliths showed a remarkable stability during laboratory and pilot plant tests .In an isothermal stability test (50000 cm3 min-1 of air containing 3600 ppm of ethanol) carried out at 400 °C, the conversion remained stable at 60% conversion for 48 hours.
IV. CONCLUSIONS
Al2O3/Al monolithic devices for using in a pilot plant were prepared by anodisation of Al sheet. Different tests varying bath temperature were carried out choosing the test performed at 40 oC for 30 min. MnOx/Al2O3/Al catalysts were prepared by impregnation of supports with aqueous and acetone manganese solutions. Impregnation using acetone as solvent produced a more reproducible, more uniform and higher load of manganese. The catalytic devices synthesized were active in the combustion of ethanol in a pilot-scale plant. The higher the manganese loads on the monolith, the higher the activity. The catalytic activity decrees with the increase in the ethanol concentration. MnOx/Al2O3/Al monoliths are efficient in remove VOCs in pilot scale plant, and are promising catalysts for VOCs elimination in real plants.
REFERENCES
1. Alifanti, M., M. Florea, S. Somacescu and V. Parvulescu, "Supported perovskites for total oxidation of toluene," Appl.Catal. B, 60, 33-39 (2005).
2. Alvarez, E., J. Blanco, J. Otero De Becerra, J. Olivares Del Valle and L. Salvador, "Platinum monolithic catalyst for SO2 abatement in dust-free flue-gas from combustion units," Lat. Am. Appl. Res., 32, 123-129 (2002).
3. Avila, P., M. Montes and E. Miro, "Monolithic reactor for environmental applications. A review on preparation technologies," Chem. Eng. J., 109, 11-36 (2005).
4. Barrio, I., I. Legorburu, M. Montes, M. Domínguez, M. Centeno and J.A. Odriozola, "New redox deposition-precipitation method for preparation of supported manganese oxide catalysts," Catal. Letters, 101, 151-157 (2005).
5. Burgos, N., M. Paulis, M. Antxustegui and M. Montes, "Deep oxidation of VOC mixtures with platinum supported on Al2O3/Al monoliths," Appl. Catal. B, 38, 251-258 (2002).
6. Chen, M. and X. Zheng, "The effect of K and Al over NiCo2O4catalyst on its character and catalytic oxidation of VOCs," J. Mol. Catal. A, 221, 77-80 (2004).
7. Craciun, R., B. Nentwick, K. Hadjiivanov and H. Knözinger, "Structure and redox properties of MnOx/ Yttrium-stabilized zirconia (YSZ) catalyst and its use in CO and CH4 oxidation," Appl. Catal. A, 243, 67-79 (2003).
8. Cubeiro, M. and J. Fierro, "Selective Production of Hydrogen by Partial Oxidation of Methanol over ZnO-Supported Palladium Catalysts," J. Catal., 179, 150-162 (1998).
9. de la Peña O'Shea, V., M. Alvarez-Galvàn, J. Fierro and P. Arias, "Influence of feed composition on the activity of Mn and PdMn/Al2O3 catalysts for combustion of formaldehyde/methanol," Appl. Catal. B, 57, 191-199 (2004).
10. Lizarbe Ruiz, L.; "Oxidación Anódica, Coloración y Sellado del Aluminio," in Teoría y Práctica de la Lucha Contra la Corrosión, Ed. J.A. González Fernández, Grafimad S.A., Madrid (1984).
11. Loayza Perez, L., "Diseño de un incinerador catalítico," Rev. Per. Quim. Ing. Quim., 5, 3-10 (2003).
12. Luo, M., M. He, Y. Xie, P. Fang and J. Jin, "Toluene oxidation on Pd catalysts supported by CeO2-Y2O3 washcoated cordierite honeycomb," Appl. Catal. B, 69, 213-218 (2007).
13. Obalová, K. Pacultová, J. Balabánová, K. Jirátová, Z. Bastl, M. Valášková, Z. Lacný and F. Kovanda, "Effect of Mn/Al ratio in Co-Mn-Al mixed oxide catalysts prepared from hydrotalcite-like precursors on catalytic decomposition of N2O," Catal. Today, 119, 233-238 (2007).
14. Oku, M., K. Wagatsuma and T. Konishi, "Relation between 2p X-ray photoelectron and Kα X-ray emission spectra of manganese and iron oxides," J. of Electron Spectroscopy and Related Phenomena, 98-99, 277-285 (1999).
15. Peluso, M., E. Pronsato, J. Sambeth, G. Busca and H. Thomas, "Catalytic combustion of ethanol on pure and alumina supported K-Mn oxides: An IR and flow reactor study," Appl. Catal. B, 78, 73-79 (2008a).
16. Peluso, M.A., L. Gambaro, E. Pronsato, D. Gazzoli H. Thomas and J. Sambeth, "Synthesis and catalytic activity of manganese dioxide (type OMS-2) for the abatement of oxygenated VOCs," Catal. Today, 133, 487-492 (2008b).
17. Ponce, S., M. Peña and J. Fierro, "Surface properties and catalytic performance in methane combustion of Sr-substituted lanthanum manganites," Appl. Catal. B, 24, 193-205 (2000).
18. Requies, J., M. Alvarez-Galvan, V. Barrio, P. Arias, J. Cambra, M. Güemes, M. Carrera, V. de la Peña O`Shea and J. Fierro, "Palladium-manganese catalysts supported on monolith systems for methane combustion," Appl. Catal. B, 79, 122-131 (2008).
19. Twing, M. and D. Webster, Structure Catalysts and Reactors, Marcel Dekker: New York (1998).
20. Wang, R. and J. Li, "Effects of precursor and sulfation on OMS-2 catalysts for oxidation of ethanol and acetaldehyde at low temperature," Environ. Sci. Technol., 44, 4282-4287 (2010).
21. Wollner, A., F. Lange, J. Schemlz and H. Knozinger, "Characterization of mixed copper-manganese oxides supported on titania catalysts for selective oxidation of ammonia," Appl. Catal. A, 94, 181-203 (1993).
22. Zhang, Z., Z. Mou, P.Yu, Y. Zhang and X. Ni, "Diesel soot combustion on potassium promoted hydrotalcite-based mixed oxide catalysts," Catal. Commun., 8, 1621-1624 (2007).
Received: August 24, 2012
Accepted: March 26, 2013.
Recommended by Subject Editor: Pedro de AlcÂntara Pessôa.
Mathematical modelling of momentum, heat and mass transfer in grains stored in silos. Part I: model development and validation
A. Arias Barreto†, R. Abalone†,‡and A. Gastón†,§
† FCEIyA, Universidad Nacional de Rosario, Av. Pellegrini 250, 2000 Rosario, Argentina. abarreto@fceia.unr.edu.ar
‡ Instituto de Física Rosario (CONICET-UNRosario), 27 de Febrero 210 bis, 2000 Rosario,Argentina rabalone@fceia.unr.edu.ar
§ CIC-UNR, FCEIyA, Universidad Nacional de Rosario, Av. Pellegrini 250, 2000 Rosario, Argentina analiag@fceia.unr.edu.ar
Abstract— A bidimensional finite element model that predicts temperature distribution, moisture migration and natural convection currents in stored grain is described. Validation was performed by comparing predicted and measured variables under laboratory conditions in corn and wheat. On average, standard errors were at most 1.7oC for temperature and 0.69 %w.b for moisture content. The sensitivity of the solution to variations in grain hygroscopic properties and to election of a sorption isotherm equation was examined. For a given temperature gradient, moisture migration was higher in soybean than in corn and wheat. As result of hygroscopic properties and permeability of grain, wheat exhibited the highest resistance to moisture migration.
Keywords— Grain Storage; Numerical Modelling; Natural Convection; Heat And Mass Transfer.
I. INTRODUCTION
Temperature and moisture content are the most important factors affecting the quality of grain during storage. The primary causes of grain spoilage are insects, mites and microflora activity, which are function of temperature and moisture content. As a general rule, reducing either or both of these variables by drying or aerating (cooling) the grain results in an enhanced grain storage environment. The storage of grains in silos involves periods where the evolution of temperature and moisture content depends on seasonal variation of climatic conditions (non-aerated periods) and others where ambient or refrigerated (chilled) air is forced to flow through the grain mass (aerated periods). Thus, maintaining the quality of properly harvested and dried grain during storage relies on understanding the momentum, heat and mass transfer processes that take place in the grain ecosystem.
A revision of published works can be found in Navarro and Noyes (2002). For storage during nonaerated periods, some researchers analyzed the heat and mass transfer process, considering only difussion in different grains: wheat (Alagusundaram et al., 1990; Jayas et al., 1994; Jia et al., 2001; Jian et al., 2005); sorghum (Abbouda et al., 1992a; 1992b); rice (Iguaz et al., 2004) and corn (Montross et al., 2002a; Al-Amri and Abbouda, 2004) among others. The effect of natural convection flows was addressed by Nguyen (1987), Dona and Stewart Jr. (1988), Smith and Sokhansanj (1990), Khankari (1992), Singh et al. (1993), Thorpe (1995), Jiménez-Islas et al. (2004). In general, these studies assumed simplified boundary conditions (imposed constant temperature) and analyzed the effect of flow inertia, silo aspect ratio, imposed temperature and temperature dependent thermal property of grain on temperature, moisture content and natural convection. Carrera-Rodríguez et al. (2011) studied the storage of sorghum as function of Raleigh number and aspect ratio considering the day-night cycle of ambient temperature. Montross et al. (2002a) investigated how accurately boundary conditions needed to be specified and what type of weather data (daily or hourly weather data, effect of wind speed and solar radiation) was required for modeling grain storage.
Most of the published models presented results for different grains such as wheat, corn, rice and sorghum considering the climatic conditions of North America or Brazil, in case of South America (Andrade et al., 2002). No references were found in the international literature regarding the simulation of heat and mass transfer in grain storage with or without aeration for the climatic conditions of Argentina for grains such as soybean, wheat and corn, which are the most intensive crop cultivars.
Bearing in mind the economical importance that grain production has for Argentina, a general study that aims to develop a comprehensive model for grain storage systems is currently under development. By use of these simulation models it is possible to predict the evolution of grain temperature and moisture content during storage periods without aeration as well as to evaluate aeration strategies for the climatic conditions of traditional and new agricultural areas of Argentina. Understanding how different combinations of initial grain condition, management practices and weather pattern affect grain storability is critical for farmers and grain industry.
The momentum, heat and moisture transfer model applied in present study is based on the work of Khankari (1992) and Montross et al. (2002a). The role of grain higroscopicity on moisture migration in stored grain was first discussed by Khankari (1992). Local thermodynamic equilibrium between the grain mass and interstitial air was assumed and by use of a sorption isotherm the moisture balance was converted into a "standard" transport equation. Moisture migration can be considered as a diffusive and convective transport of water vapour through the interstitial air of the grain bulk, where moist grain itself acts as a
In a first stage of the research project, a heat and mass transfer model was developed to analyze the storage conditions of wheat hold in hermetic bags (silobags), a new storage system widely adopted in Argentina. The model was validated by comparison of predicted grain temperature and moisture content with measured values carried out in farm level trials (Gastón et al., 2009). Moisture content (MC) showed higher discrepancy than temperature as result of the averaging sampling procedure and grain variability typically found in large grain masses. This model was further extended to include the prediction of O2 and CO2 concentration in the intergranular air, variables used to monitor grain storability in the silo-bag (Abalone et al., 2011a, 2011b). In the previous models, diffusion was the only transfer mechanism taken into account.
This is the second stage, in which natural convection flows were incorporated to the transport process. The study was divided in two parts, the first one devoted to the validation and sensibility analysis of the model and the second one to study the storage of soybean in Argentina.
The aim of present work was:
1. to validate the implemented momentum, heat and moisture content model with published experimental data of grain temperature and moisture migration under controlled laboratory conditions.
2. to carry out a sensibility analysis with respect to higroscopic properties of grain.
3. to compare by numerical simulation, migration in corn, wheat and soybean under the same laboratory conditions.
II. HEAT TRANSFER MODEL
A. Mathematical Model
The following assumptions were considered for development of momentum, heat and moisture balances:
1— grain bulk is modeled as an isotropic porous media with effective transport properties.
2— in a control volume, grain and intergranular air are in local thermodynamic equilibrium.
3— the air-vapour mixture behaves as an ideal gas
4— interstitial air flow was modeled by Darcy's law, as Darcy Number Da is about 10-8(Jiménez Islas et al. 1999).
5— Boussinesq's approximation is applied.
6— grain bed shrinkage is negligible.
7— accumulation of moisture in the air and moisture diffusion by grain to grain contact are negligible.
8— aerobic respiration of the grain ecosystem is modeled according to the complete combustion of a typical carbohydrate
 | (1) |
 | (2) |
 | (3) |
 | (4) |
 | (5) |
 | (6) |
 | (7) |
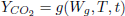
 sorption isotherm sorption isotherm | (8) |
 rate of CO2 production rate of CO2 production | (9) |
Equation (1) is the continuity equation and Eq. (2) is Darcy's law.
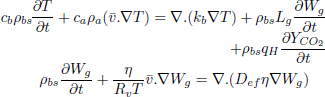
Equation (3) is the energy balance which includes two source terms. The first one states that grains act as a sink/source of moisture absorbing or releasing the latent heat of vaporization/condensation and the second one represents the heat released by respiration of the ecosystem.
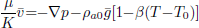
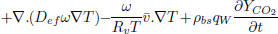
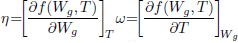
Equation (4) is the moisture balance where the contribution of moisture gradients, temperature gradients and moisture released by respiration to the overall transport process can be identified. In term, the contribution of temperature gradients to moisture transport process depends on ω while η affects the transport due moisture gradients and natural convection flows.
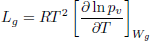
Both parameters, ω and η, depend on the higroscopic properties of grain (sorption isotherm, Eq. (8)). Expressions for model functions Lg, η, ω, are presented in detail in Gastón et al. (2009).
Correlations available in literature were used to model respiration rate of wheat (White et al., 1982) and corn (Bern et al., 2002) which are presented in a general form by Eq.(9). Model implementation is also given in Gastón et al. (2009).
Using the definition of the stream function, continuity is satisfied and the momentum balance is determined. For axial symmetry the resulting expressions are:
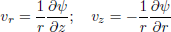 | (10) |
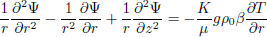 | (11) |
To complete the statement of the problem, boundary and initial conditions must be specified.
B. Model Validation.
To validate the numerical model, predicted temperature and MC were compared with experimental results obtained by Khankari (1992) for corn and wheat. Figure 1 shows the diagram of the experimental setup. Two cylindrical barrels where filled with grain at 13%w.b initial MC. The top and bottom of the grain were thermally insulated and impermeable to moisture transfer. The barrels were placed in an insulated chamber kept at 0 to 4°C by forced convection of cool air. Hot water at 45 to 46°C was circulated through copper pipes located at the center line of each barrels. Temperatures along the radial direction at vertical sections A, B, C and D (Fig. 2) were recorded every hour by an electronic data logger. One barrel was opened after 10 days and the other after 20 days to remove the sample bags for moisture content determination. The above experiment was simulated by solving the momentum, heat and mass transfer model in two dimensional cylindrical coordinate system. For the energy balance, thermal insulation was assumed at the top and bottom of the barrel and constant temperatures Tin and Tout at the inner and outer wall, respectively. To model an impermeable condition to moisture transfer, a value of zero was specified for the stream function and for the normal gradient of water vapour pressure on the boundary domain Γ. Therefore, boundary conditions were expressed as:
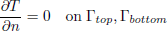 | (12) |
 | (13) |
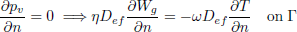 | (14) |
 | (15) |
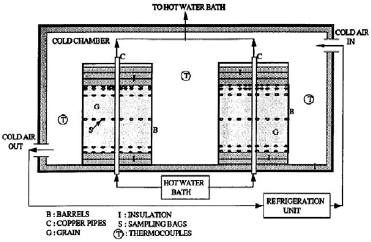
Figure 1: Schematic diagram of the experimental setup
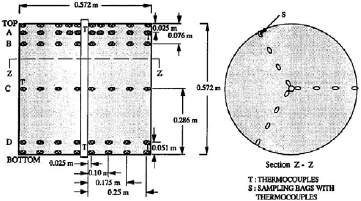
Figure 2: Schematic location of thermocouples and sampling bags (from Khankari et al., 1992)
The initial moisture content and temperatures distribution were assumed uniform
 | (16) |
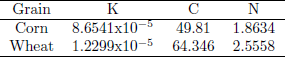
Moisture dependent physical properties of corn and wheat were taken from Khankari (1992). Hygroscopic properties of grain were modeled with the Modified Henderson Thompson Isotherm (MHTI); sorptional constants are listed in Table 1.
Table 1. Modified Henderson Thompson constants
C. Numerical Solution.
The model was implemented in COMSOL Multiphysics 4.2a and solved by the Finite Element Method (FEM). The procedure to solve PDE by FEM is well documented and can be found in specific literature (Cook et al., 1989; Zienkiewicz and Taylor, 1989). For the numerical solution, COMSOL Multiphysics 4.2a defaults setting were applied: quadratic lagrangian elements, fourth order numerical quadrature, Backward Difference Formula (BDF) for time integration with a free time step. UMFPACK solver was selected to solve the PDE system (unsymmetrical multifrontal method and direct sparse LU factorization).
Analysis of mesh dependence of numerical results was performed for uniform meshes of 20x20 (M1), 40x40 (M2), 80x80 (M3), 160x160 (M4) elements. Calculations were carry out for a fixed time step of 1 hour and a free time step. Temperature and moisture content were compared at levels A, B, C and D. For both time steps, the maximum relative difference between results obtained with M4 and M1 were observed at level A. Richardson extrapolation was used to estimate the variables as the grid spacing tends to zero. The relative differences between the extrapolated and predicted values using M2 were 0.39% for temperature and 1.47% for moisture content, 0.11% and 0.48% using M3 and 0.03% and 0.12% using M4, respectively. Therefore, M3 and a free time step were selected to run the model.
III. RESULTS AND DISCUSSION
A. Predicted temperature and moisture content.
Temperature and MC distribution in corn after 10 and 20 days are presented in Fig. 3 and Fig. 4, respectively. Isotherm distributions shown in Fig. 3a and 3b are identical, so it can be concluded that after 10 days the grain reached a steady thermal state. The influence of natural convection flows circulating in a clockwise sense was not very strong as the isotherm distribution at the bottom and top of the barrel, slightly deviated from the pattern characteristic of a typical conductive process (lines parallel to the inner and outer walls).
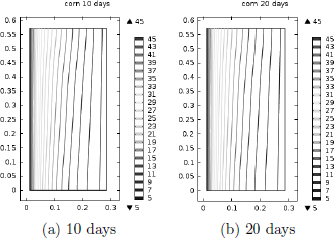
Figure 3: Isotherm distribution in corn predicted with K1=1.61x 10 -8m2 and (MHTI).
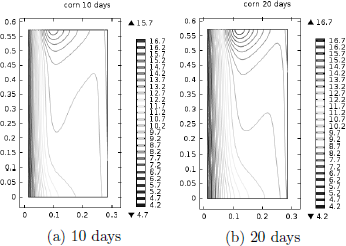
Figure 4: Moisture content isoline distribution predicted with K1=1.61x 10 -8m2 and (MHTI).
In contrast, Fig. 4a and 4b show that a steady MC distribution was not achieved. At the beginning, as result of the radial temperature gradients developed at the hot inner wall, moisture migrated by diffusion towards the interior, while on the other side, towards the cold outer wall. As natural convection flows developed, the accumulated MC at r~(0.08-0.10 m) was transported by the interstitial air creating a zone of higher MC at the top and a lower one at the bottom of the grain mass. Simulations results after 20 days showed that the outwardly radial flow at the top moved the wet spot towards the outer corner (not shown).
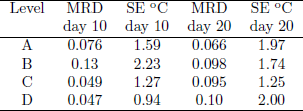
Predicted radial temperature and moisture content profiles at levels A, B, C and D after 10 and 20 days where compared with experimental data. The mean relative deviation (MRD) and standard error (SE) were used to determine the model accuracy. Results presented in Table 2 showed a better temperature agreement at locations C and D than at A and B. On average, total MRD was 0.083 and total mean SE 1.6°C.
Table 2: Temperature mean relative deviation (MRD) and standard error (SE) of the fit. K1=1.61x 10⁻⁸m2
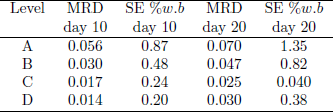
Mean relative deviation (MRD) and standard error (SE) for MC were listed in Table 3, again showing the best fit at C and D levels. At section A, by effect of convection transport, the model over predicted the amount of moisture accumulation, though in present study it was considerably lower than that predicted by Khankari et al. (1992). On average, total MRD was 0.036 and total mean SE 0.59 %w.b.
Table 3: MC mean relative deviation (MRD) and standard error (SE) of the fit. K1=1.61x 10⁻⁸m2
A simulation was also carried out for a permeability value of K2=3.59x10⁻⁹m2, proposed by Khankari, (1992) to improve their predictions. On average, total MRD and SE for temperature were very similar, 0.086 and 1.7°C, respectively. The amount of moisture accumulation was reduced at A and B locations, but predictions worsen at level D. Nevertheless, on average total MRD decreased to 0.040 and SE to 0.54 %w.b.
Predicted temperature at locations A, B C and D are plotted in Fig. 5 and MC profiles in Fig. 6.
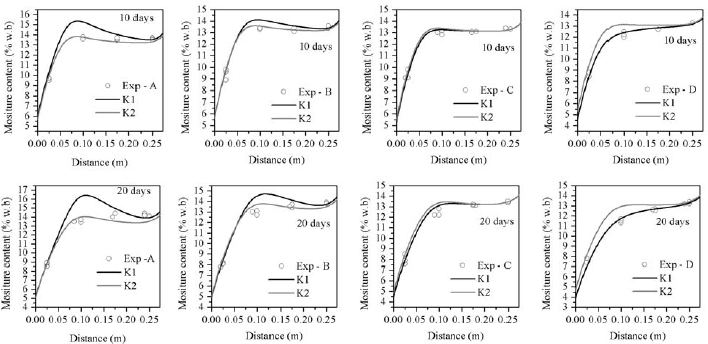
Figure 5: Comparison between measured and predicted moisture content distribution in corn; K1=1.61x10⁻⁸m2; K2=3.59x10⁻⁹m2
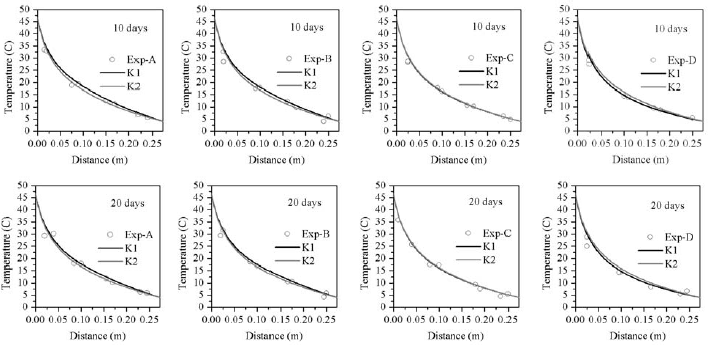
Figure 6: Comparison between measured and predicted temperature content distribution in corn; K1=1.61x10⁻⁸m2; K2=3.59x10⁻⁹m2
Good agreement between measured and predicted variables was obtained also for wheat (not shown).
For a permeability value of K1=5.96x10⁻⁹m2, average MRD for temperature was 0.065 and SE was 1.38°C; while 0.035 and 0.47 %w.b for MC. For a permeability value K2=2.55x10⁻⁹m2, resulted 0.066 and 1.40° for temperature, while 0.034 and 0.46 %w.b for MC.
It can be concluded that the numerical model satisfactorily predicted the heat transfer and moisture mi- gration in the grain bulk. Also the errors of present model were of the same order as those reported by other authors (Iguaz et al., 2004; Alagusundaram et al., 1990; Montross et al., 2002b).
B. Effect of hygroscopic properties of grains. Sensibility analysis.
The sensitivity of moisture migration to hygroscopic properties of grain was tested by running the model with a ± 10% change in the constants of the Modified Henderson Thompson Isotherm (MHTI), listed in Table 1 (base case). When dealing with biological products such variations are likely to appear.
Figure 7a compares MC profiles after 20 days at A and D levels for both permeability values. On average, the difference between extreme curves was at most of 2 %w.b points in the layer close to the hot wall where the steeper moisture gradients developed.
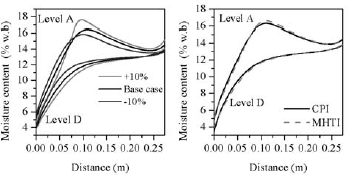
Figure 7: Sensitivity of predicted MC to higroscopic properties of grain after 20 days, at level A and D; a) Results using ±10% of MHTI constants; b) Comparison of predicted MC using MHTI and CPI; K1=1.61x 10⁻⁸m2
Another commonly used isotherm, Chung Pfost Isotherm (CPI), was also implemented to evaluate the differences that may arise in the results when it is applied. Chen and Morey (1989) presented sorption data for corn fitted to four different sorption isotherms. This information was used to run two simulations for the previous laboratory conditions. In the first, sorption data was modeled with (MHTI) and in the second, with (CPI). Comparison at levels A and D showed that predicted profiles almost overlapped, being the relative differences less than 2% (Fig.7b).
C. Comparison of moisture migration in wheat, corn and soybean under laboratory conditions
Figures 8a and 8b compare coefficients η and ω of wheat, corn and soybean as function of MC and temperature (10, 20 and 30°C), calculated by use of the Modified Henderson Thompson Isotherm. In the range 6-16 %w.b, the effective diffusivity of water vapour due to moisture gradients (η Def ) is higher for wheat than for corn and soybean (Fig. 8a). Therefore, steeper moisture gradients should be expected in bulk soybean and corn than in wheat.
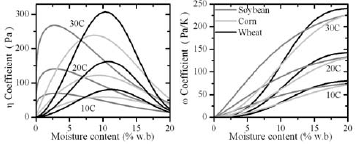
Figure 8: Variation of ? and ? with temperature and moisture content of grain bulk
On the other hand, for MC less than 13 %w.b, the effective diffusivity of water vapour due to temperature gradients (ωDef ) is higher for soybean while comparable for wheat and corn. The effect of temperature gradients was treated as a source or sink term in the moisture balance equation. In consequence to equilibrate with the surroundings soybean will liberate more moisture compared to corn and wheat.
For comparison, moisture migration in wheat, corn and soybean was analyzed for the previous laboratory conditions. One simulation was run considering moisture transfer only by diffusion and another including both diffusion + convection transport. When diffusion was the only transfer mechanism, MC distribution only depended on the radial coordinate. Thus, only MC profile after 20 days was plotted at location A (Fig. 9a). It was observed that in a layer 0.10 m width close to the inner wall, soybean presented the steeper MC gradient and higher MC changes while wheat exhibited more resistance to moisture migration.
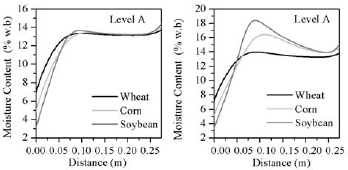
Figure 9: Comparison of moisture migration at level A in corn, wheat and soybean; a) Diffusion transport; b) Diffusion +convection transport
A slightly wet spot developed around r= 0.10 m where the MC peak ranged from 13.33%w.b (wheat) to 13.63% w.b (soybean). Fig. 9b compares moisture accumulation at level A when convection transport was included. MC pattern for wheat was very similar to the previous one (diffusion transfer) as consequence of it low permeability (K= 0.35x10⁻⁸ m2). The effect of convection transport increased with grain permeability (corn, K=1.61x10⁻⁸ m2; soybean, K=1.85x10⁻⁸m2) as the MC peak increased to 16.5 %w.b for corn and to 18 %w.b for soybean.
IV. CONCLUSIONS
In this work a bidimensional coupled momentum, heat and mass transfer model to predict the temperature distribution and moisture migration in a bulk of grain was described.
Validation was performed by comparing predicted and measured variables under laboratory conditions in corn and wheat. On average, standard errors were at most 1.7°C for temperature and 0.69% w.b for MC, while mean relative difference were 0.086 and 0.04, respectively. The model showed higher sensibility to variation in hygroscopic properties than to election of sorption isotherm. As result of hygroscopic properties and permeability of grain, for a given temperature gradient, MC migration was higher in soybean than in corn and wheat.
NOTATION
| ca | specific heat capacity of air, Jkg-1K-1 |
| cb | specific heat capacity of grain bulk, Jkg-1K-1 |
| Def | effective diffusivity of water vapour in intergranular air, m2s-1 |
| Dv | water vapour diffusivity in air, m2s-1 |
| g | gravitational acceleration, ms-2 |
| kb | thermal conductivity of grain bulk, Wm-1K-1 |
| K | grain permeability, m2 |
| Lg | latent heat of vaporization of moisture in the grain, Jkg-1 |
| n | normal direction |
| pv | partial pressure of water vapour, Pa |
| p | pressure, Pa |
| qH | heat release in respiration, 10.74 Jmg-1[CO2] |
| qW | water vapour release in respiration, 4.09x10⁻⁵ kg [H2O] mg-1 [CO2] |
| R | gas constant, 8.314 Jmol-1K-1 |
| Rv | water vapour gas constant, 461.52 Jkg-1K-1 |
| t | time, s |
| T | temperature, °C, K |
| v | superficial velocity, ms-1 |
| Wg | grain moisture content, d.b |
| YCO2 | respiration rate, mg[CO2]kg-1[dry matter] 24h |
| Greek Symbols | |
| β | thermal expansion coefficient of air, K-1 |
| Γ | boundary domain |
| ε | porosity |
| η | change in the partial pressure due to change in the moisture content at constant temperature, Pa |
| τ | tortuosity |
| ρa | air density, kgm-3 |
| ρbs | dry grain bulk density, kgm-3 |
| ω | change in the partial pressure due to change in the temperature at constant moisture content, PaK-1 |
| ψ | stream function, m3s-1 |
| Ω | domain |
| μ | viscosity of air, kgm-1s-1 |
| Subscripts | |
| 0 | initial or reference value |
ACKNOWLEDGEMENTS
The authors like to acknowledge the following institutions: ANPCYT/FONCYT (PICT 2008 0460), National University Rosario (PID ING295) and INTAPRECOP: Postharvest Efficiency for the financial support.
REFERENCES
1. Abalone, R.M., A. Gastón, L. Cardoso and J. Rodríguez, "Gas concentration in the interstitial atmosphere of a wheat silo-bag. Part I: Model development and validation," J. of Stored Prod. Research, 47, 268-275 (2011a).
2. Abalone, R.M., A. Gastón, L. Cardoso and J. Rodríguez, "Gas concentration in the interstitial atmosphere of a wheat silo-bag. Part II: Model sensitivity and effect of grain storage conditions," J. of Stored Prod. Research, 47, 276-283 (2011b).
3. Abbouda, S.K., D.S. Chung, P.A. Seib and A. Song, "Heat and mass transfer in stored milo. Part I: Heat transfer model," Trans. of ASAE, 35, 15691573 (1992a).
4. Abbouda, S.K., D.S. Chung, P.A. Seib and A. Song, "Heat and mass transfer in stored milo. Part II: Mass transfer model," Trans. of ASAE, 35, 15751580 (1992b).
5. Alagusundaram, K., D.S. Jayas, N.D.G. White and W.E. Muir, "Three dimensional finite element heat transfer model of temperature distribution in grain storage bins," Trans. of ASAE, 33(2), 577-584 (1990).
6. Al-Amri, A.M.S. and S.K. Abbouda, "Application of a mass transfer model for simulation and prediction of moisture distribution in stored corn grains," Sci. J. of King Faisal Univ. (Basic and Applied Sciences), 5, 197-212, (2004).
7. Andrade, E., S.M. Couto, D. Queiroz and L. Faroni, "Three dimensional simulation of the temperature variation in corn stored in metallic bin," ASAE Annual Meeting, Paper N02-3150 (2002).
8. Bern, C.J., J.L. Steele and R.V. Morey, "Shelled corn CO2 evolution and storage time for 0.5% dry matter loss," Applied Eng. in Agriculture, 16, 703-706 (2002).
9. Carrera-Rodríguez, M., G.M. Martínez-Gonzáles, J. Navarrete Bolaños, E. Botello Alvarez, R. Rico-MartÃnez, and H. Jiménez-Islas, "Transient numerical study of the effect of ambient temperature on 2D cereal grain storage in cylindrical silos," J. of Stored Prod. Research, 47, 106-122, (2011).
10. Chen, C.C. and R.V. Morey, "Comparison of four EMC/ERH equations," Trans. of ASAE, 32, 980990 (1989).
11. Cook, R., D. Malkus and M. Plesha, Concepts and applications of finite elements analysis, John Wiley & Sons (1989).
12. Dona, C.L. and W.E. Stewart Jr, "Numerical analysis of natural convection heat transfer in stored high moisture corn," J. Agric. Engng Res , 40, 275-284 (1988).
13. Gastón, A., R. Abalone, R.E. Bartosik and J.C. Rodríguez, "Mathematical modelling of heat and moisture transfer of wheat stored in plastic bags (silo-bags)," Biosystems Eng., 104, 72-85 (2009).
14. Iguaz, A., C. Arroqui, A. Esnoz and P. Vírseda, "Modelling and simulation of heat transfer in stored rough rice with aeration," Biosystem Eng., 89, 6977 (2004).
15. Jayas, D.S., K. Alagusundaram, G. Shunmugam, W.E. Muir and N.D.G. White, "Simulated temperatures of stored grain bulks," Canadian Agric. Eng, 36, 239-245 (1994).
16. Jia, C., D.W. Sun and C. Cao, "Computer simulation of temperature changes in wheat storage bin," J.of Stored Prod. Research, 37, 165-177 (2001).
17. Jian, S., D.S. Jayas, N.D.G. White and K. Alagusundaram, "A three-dimensional, asymmetric, and transient model to predict grain temperatures in grain storage bins," Trans. of ASAE, 48, 263-271 (2005).
18. Jiménez-Islas, H., J. Navarrete Bolaños and E. Betello Alvarez, "Numerical study of the natural convection of heat and 2D mass of grain stored in cylindrical silos," Agrociencia, 38, 325-342 (2004).
19. Khankari, K.K., Prediction of moisture migration in stored grain, Ph.D. Thesis, Univ. of Minnesota, St. Paul (1992).
20. Montross, D.M., D.E. Maier and K. Haghighi, "Development of a finite-element stored grain ecosystem model," Trans. of ASAE, 45, 1455-1464 (2002a).
21. Montross, D.M., D.E. Maier and K. Haghighi, "Validation of a finite-element stored grain ecosystem model," Trans. of ASAE, 45 1465-1474(2002b).
22. Navarro, S. and R. Noyes, The Mechanics and Physics of Modern Grain Aeration Management, CRC Press (2002).
23. Nguyen, T.V., "Natural convection effect in stored grains: a simulation study," Drying Technology, 5, 541-560 (1987).
24. Singh, A.K., E. Leonardi and G.R. Thorpe, "A solution procedure for the equations that govern threedimensional free convection in bulk stored grains," Trans. of ASAE, 36, 1159-1173 (1993).
25. Smith, E.A. and S. Sokhansanj, "Moisture transport caused by natural convection in grain stores," J. Agric. Engng. Res., 47, 23-34 (1990).
26. Thorpe, G.R, "Modelling Moisture Migration in Stored Grains," Proc. of an Int. Conf. Grain Drying in Asia, 99-122 (1995).
27. White, N.D.G., R.N. Sinha and W. E. Muir, "Intergranular carbon dioxide as an indicator of biological activity associated with the spoilage of stored wheat," Canadian Agric. Eng., 24, 35-42 (1982).
28. Zienkiewicz, O.C. and R.L. Taylor, The finite element method, McGraw Hill (1989).
Mathematical modelling of momentum, heat and mass transfer in grains stored in silos. part II:
Model application
A. Arias Barreto†, R. Abalone†,‡ and A. Gastón†,§
† FCEIyA, Universidad Nacional de Rosario, Av. Pellegrini 250, 2000 Rosario, Argentina. abarreto@fceia.unr.edu.ar
‡ Instituto de Física Rosario (CONICET-UNRosario), 27 de Febrero 210 bis, 2000 Rosario,Argentina rabalone@fceia.unr.edu.ar
§ CIC-UNR, FCEIyA, Universidad Nacional de Rosario, Av. Pellegrini 250, 2000 Rosario, Argentina analiag@fceia.unr.edu.ar
Abstract— A 2D finite element momentum, heat and mass transfer model was applied to predict natural convection flows, temperature distribution and moisture migration in soybean stored in a cylindrical bin without aeration from autumn to spring for the weather conditions of Rosario, Argentina. The effect of the initial moisture content and temperature of the grain (13%w.b and 25, 20 and 15°C) on storability conditions was evaluated. During winter, stronger natural convection flows developed for 25°C, promoting an average moisture migration of 0.4%w.b and average grain temperature decrease of 5°C at the bin bottom. For 20°C, these values reduced to 0.15%w.b and 3°C. For 15°C, safe conditions remained and moisture migration was negligible during winter, but in spring, solar radiation and natural convection increased the temperature of a boundary layer of 1.5 m width above 18°C. Interstitial equilibrium relative humidity remained below the threshold for mold development (ERH > 75%). During spring, natural convection increased as the initial grain storage temperature decreased. Permeability has the strongest effect on natural convection and a five fold increase of this parameter resulted in the development of spoilage areas in the upper part of the bin. Soybean and corn showed comparable moisture migration while for wheat was not significant.
Keywords— Grain Storage; Numerical Modelling; Natural Convection; Heat and Mass Transfer.
I. INTRODUCTION
Numerical simulation models based on transport principles are useful and inexpensive tools to predict the potential spoilage of stored grain. They can play a major role in the design and evaluation of methods for reducing temperature and moisture gradients in stored grains, which are the two main factors that affect grain quality during storage. Numerous models have been developed for conventional storage systems and applied to analyze the heat and mass transfer process in different grains. A revision of published results can be found in Navarro and Noyes (2002). These authors' remark that the major advantage of validated models is the possibility to conduct "what-if " studies and thus predict storage conditions based on different climatic regions of the world. For the climatic conditions of South America, most of the published work refers to Brazil, addressing the analysis of heat and mass transfer of grains without aeration (Andrade et al., 2002) or the performance of aeration strategies for typical agricultural locations (Sinicio and Muir, 1996, 1998; Martins et al., 2001; Lopes et al., 2006, 2008a, 2008b; Khatchatourian and Oliveira, 2006). No references were found in the international literature regarding the simulation of heat and mass transfer, for the climatic conditions of Argentina. Studies on transport phenomena for wheat, from summer to winter were presented in Balzi et al. (2008) and Abalone et al. (2006).
The aim of this work was to analyze storability of soybean from autumn to summer, for the weather conditions of Rosario (Lat. 32°57'S, Long. 60°38'W), located on one of the most productive agricultural region of Argentina. The effect of initial grain temperature and permeability on the development of natural convection flows, temperature distribution and moisture migration was examined. A comparative analysis of moisture migration for soybean, corn and wheat, the three most important grains cultivated in Argentina, is also provided.
II. HEAT TRANSFER MODEL
A. Mathematical Model
The momentum, heat and mass transfer model described in Part I of present study (Arias Barreto et al., 2013) was applied to predict natural convection flows, temperature distribution and moisture migration. The main model assumptions were local thermodynamic equilibrium between the grain and interstitial air, negligible accumulation of moisture in the interstitial air and moisture diffusion by grain to grain contact, ideal gas behavior of the air-vapor mixture and Darcy's flow.
To accurately predict grain spoilage during storage, temperature and moisture distribution must be correctly estimated. They respond to seasonal variation of climatic conditions. Thus, realistic boundary conditions must include the effect of solar radiation and wind speed as discussed by Montross et al. (2002), who also analyzed the differences arising when daily or hourly weather data are inputs of the simulation.
In present study, a 2D axisymmetric domain was considered as shown in Fig. 1. Boundary and initial conditions are expressed by Eqs. (1) to (8). To satisfy symmetry conditions on Γ1, the stream function and normal gradient of water vapour pressure must vanish. The same condition must be applied on the rest of the boundaries to model an impermeable condition to moisture transfer. Both conditions are represented by Eqs. (1) and (2). Auxiliary expressions for model functions η and ω were given in detail in Abalone et al. (2006) and Gastón et al. (2009). A symmetry temperature condition was applied on Γ1 and thermal isolation on Γ2 as expressed by Eq. (3).
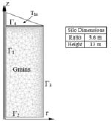
Figure 1: Schematic diagram of the domain
 | (1) |
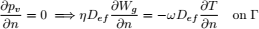 | (2) |
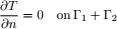 | (3) |
 | (4) |
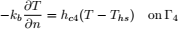 | (5) |
 | (6) |
 | (7) |
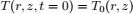 | (8) |
On Γ3, convection and radiation with the surroundings and solar radiation were taking into account (Eq. (4)). The equivalent heat transfer coefficient heq includes the effect of wind speed (hc3) and conduction through the steel wall (hbin). A simplified boundary condition was applied on Γ4, assuming that the top grain surface exchanges energy with an "environment" which has a variable temperature Ths(t), the temperature of the bin headspace (Alagusundaram et al., 1990). Definitions of headspace temperature Ths, sky temperature Ts as well as model parameters of boundary conditions are listed in Table 1.
Table 1: Mathematical model parameters
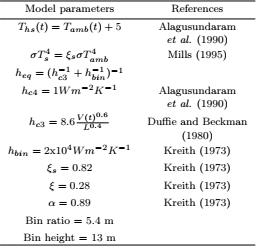
To estimate solar radiation on the vertical wall, the cylindrical bin was approximated by a prism of 32 sides (Jiang and Jofriet, 1987). To account for seasonal variations and orientation, solar radiation G on each plane was estimated according to Duffie and Beckmann (1980) and the mean value over the 32 planes was applied on the bin wall. Horizontal global solar irradiance was calculated applying Model C (Iqbal, 1983). Model C is a well documented radiation model that evaluates solar radiation by considering the mechanisms of transmittance, reflectance and absorbance of the atmosphere.
B. Numerical Solution. Finite Element Formulation
Figure 1 shows the discretized calculation domain. The model was implemented in COMSOL Multiphysics 4.2a and solved by the Finite Element Method. A refined mesh was generated at the boundaries were the highest temperature and moisture gradients were expected to occur. Quadratic Lagragian elements and a fourth order numerical quadrature were applied. UMFPACK solver was selected to solve the PDE system (unsymmetrical multifrontal method and direct sparse LU factorization).
III. APPLICATION EXAMPLES
A. Storage of soybean from autumn to summer. Effect of initial storage temperature
The numerical model was applied to study the storage of soybean during seven months (210 days), from 15th May to 15th December (autumn-winter-spring) for the climatic conditions of Rosario (Lat. 32°57'S, Long. 60°38'W) in the south of Santa Fe province, Argentina. Averaged daily weather data (ambient temperature, relative humidity, wind speed and solar radiation) from 1981 to 1990 were used as input data.
Simulations where carried out for 13 %w.b initial moisture content (MC) and 25, 20 and 15°C initial grain temperature. Moisture dependent thermal properties for soybean were taken from ASAE Standard D241.4 (2003) and Navarro and Noyes (2002); permeability and coefficients of the Modified Henderson Thompson isotherm from Brooker et al. (1992).
Predicted streamlines, temperature and MC distributions for 25°C are presented for several selected months (July, October, December) in Figs. 2a through 2c. This rather high initial temperature was selected as it represents the worst initial storage condition.
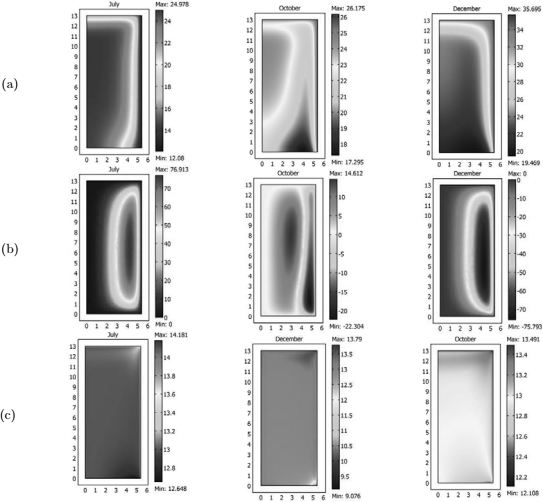
Figure 2: Predicted variables for soybean stored at 25°C and 13 %w.b permeability K1=1.86 10-8 m2 (a) Isotherm distribution; (b) Streamline distribution; (c) Moisture content distribution
Isotherm distributions are shown in Fig. 2a. Ambient temperature and solar radiation decreased from May to July. In response, temperature gradients developed near the top surface and vertical wall promoting natural convection flows flowing clockwise. During the first month, as convection transport was weak, isotherms remained parallel to the boundaries, typical of a conductive transport phenomenon. By the end of July the circulation displaced the isotherms towards the top and upper corner wall, while at the bottom bended them towards the center of the bin. Convection flows contributed to cooling the grain layer at the outer bottom corner to near 17°C by end of September, temperature level which arrests insect development, but unfavorable storage conditions remained in most regions of the bin. By December the effect of solar radiation was strong, being the temperature at the outer boundary about 10°C higher than at the center of the bin.
Streamlines are illustrated in Fig. 2b. A positive value of the stream function ψ means a clockwise circulation. Convection flows reached their maximum value ψmax of 77 m3d -1 in July. By the end of September and during October the flow reversed and reached in December similar values to those of July.
Moisture content redistribution is presented in Fig. 2c. As result of temperature gradients moisture migrated by diffusion below the top surface and along the side wall in a narrow boundary layer (∼ 0.15 m). Counter-clockwise circulation from May to September transported moisture from the bottom to the top layer and outer corner. In July, a very small wet spot at 14 %w.b (not visible in Fig. 2c) developed close to the side wall. By the end of September, on average, MC increased 0.3 % at the top corner and decreased in the same proportion at the bottom one. After the flow reversal in October, the spot of higher MC accumulated at the top outer corner started to be redistributed towards the interior. In this region, radial inward temperature gradients and counterclockwise convection flows contributed to transport moisture form outside to inside.
ERH was calculated by use of the sorption isotherm. On average, ERH increased from 72 to 75 % (low risk for mold development) in the layers of higher MC while decreased below 70 % at the bottom of the bin.
For 20°C initial temperature, similar streamline patterns were obtained (not shown). The effect of natural convection flows was lower during winter (ψmax ∼ 47 m3d-1); the flow reversal started earlier (end of August) and continued during September. By December ψmax increased to 100 m3d-1. The lower initial temperature and the effect of solar radiation warming the bin side wall minimized the radial temperature gradient (driving force for natural convections flows) during autumn and winter, while maximized it during spring. The isotherm distribution showed that by September the central region of the bin (r<3 m; 3 m<z<12 m) remained nearly at 19 - 20°C. MC redistribution at the top surface decreased to 0.1 - 0.2 %w.b from June to August and the zone of lower MC at the bottom became very small.
For 15°C initial temperature, safe conditions remained during winter. From May to August convection flows were low (ψmax ∼ 16 m3d -1) and migration was practically suppressed. In spring, solar radiation increased the temperature of a boundary layer of about 1.5 m width above 18°C and stronger natural convection developed (ψmax ∼ 126 m3d -1).
Numerical results obtained for soybean were in accordance with published results for wheat and corn (Khankari et al., 1995; Montross and Maier, 2001; Casada et al., 2002). In present study, the inclusion of solar radiation and less sever ambient conditions during winter reduced the magnitude of natural convection flows for comparable values of grain permeability and bin size. In general, patterns of temperatures, moisture content, and streamline distribution were compatible with those obtained by other researches. (Montross, 1999; Jia et al., 2000; 2001; Carrera-Rodríguez et al., 2011).
The evolution of average grain temperature, average ambient temperature and horizontal solar irradiance are plotted in Fig. 3a and interstitial air equilibrium relative humidity (ERH) in Fig. 3b. On average, theses results show that the feasibility of storing soybean without aeration is acceptable for 15°C initial storage temperature (temperatures < 17°C prevent insect infestation; ERH < 75 % mold development), though locally, risky areas were identified. In the other cases, the climatic conditions during winter were not as severe as to naturally cool the grain to safety levels.
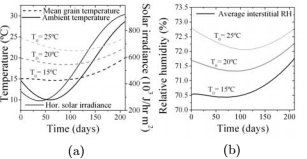
Figure 3: Average soybean temperature and interstitial air ERH from winter to spring as function on initial storage temperature
B. Effect of grain permeability
Relevant model parameters are listed in Table 2 for wheat, corn and soybean. It is observed that moisture dependent bulk thermal properties of grains (evaluated at 13 %w.b) are comparable while a large range in values of permeability was found in the literature.
Table 2: Grain properties evaluated at 13 %w.b
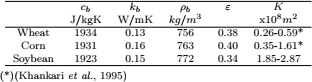
Moisture migration depends on the intensity of natural convection flows. The magnitude of these currents is governed by the Rayleigh number of the porous media Ra. Therefore, for a given temperature difference ΔT and bin radio R, on average, the source of natural convection flows (Eq.(11), Part I of present study) is 2.5 times higher for soybean than for corn and 6 times higher than for wheat. To quantify the effect of permeability on grain cooling and moisture migration during winter, the standard case (soybean, 13 %w.b and 25°C initial conditions, K = 1.85x10⁻⁸ m2) was run for the range shown in Table 1, K1=0.255x10⁻⁸ m2, K2 = K, K3=2.87x10⁻⁸ m2, and K4=5K. Table 2 compares maximum value of the stream function (ψmax), temperatures at the center and boundary wall in the bin bottom layer (z<2.5 m) and moisture accumulation at the corner area by end of August (before radiation starts to warm the outer boundaries and flow to reverse).
For the lowest permeability, migration was not significant. For the highest one, at the top corner MC increased to 15.8 %w.b and ERH to 79 %, creating conditions for potential grain spoilage.
As result of the 5 times increase in the intensity of natural convection flows, in the lower part of the bin (z<5 m), the temperature at the center decreased from 25 to 19°C. Such a strong natural cooling effect in the central part of the bin is not consistent with general field observation.
C. Comparison of moisture migration in wheat, corn and soybean
Finally, simulations were run setting model parameters to those of wheat and corn. Predicted results at the end of September were compared with those obtained for soybean (standard case) in Fig. 4a through 4c. Temperature isotherms for wheat remain parallel to the boundaries, typical of conductive transfer, while those for corn and soybean showed the cooling effect at the bottom of the bin by natural convection flows 8 times higher than those for wheat. As expected, moisture migration for wheat was very low and redistribution concentrated by diffusion at the boundaries in response to temperature gradients (for both values of permeability shown in Table 1). When permeability of soybean and corn was similar (K = 1.85x10⁻⁸ m2 and K = 1.61x10⁻⁸ m2, respectively) moisture migration was about 0.3 %w.b for both grains. A close inspection of the wet spot at the top corner showed that accumulation was higher for soybean than for corn, with stepper moisture gradients as discussed in Part I of this study.
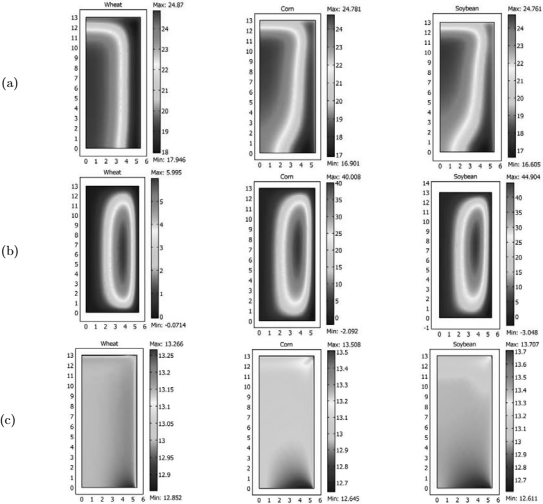
Figure 4: Predicted variables at the end of September for wheat, K= 0.255x10⁻⁸ m2; corn, K= 1.61x10⁸ m2; soybean K= 1.86x10⁻⁸ m2(a) Isotherm distribution; (b) Streamline distribution; (c) Moisture content distribution
IV. CONCLUSIONS
In this work, a 2D momentum, heat and mass transfer model was applied to predict natural convection flows, temperature distribution and moisture migration in soybean stored in a cylindrical bin without aeration for the weather conditions of Rosario, Argentina.
For soybean stored at 25°C and 13 % w.b convection flows and temperature gradients during autumn and winter promoted a moisture migration of about 0.3 % w.b near the top grain surface and side wall. At the bin bottom moisture content decreased in the same proportion. The upper layers of grains remained almost at the initial temperature while the temperature of the bottom layers ranged from 23 to 17°C. As the initial grain temperature decreased convection flows decreased during winter and moisture migration reduced. At 15°C safe conditions remained during winter but during spring the temperature of a boundary layer 1.5 m width increased above 18°C. Permeability has the strongest effect on natural convection and as result of moisture migration areas of potential spoilage may develop at the upper corner of the bin. A comparative study showed that moisture migration during autumn and winter was very small for wheat and comparable for corn and soybean.
NOTATION
| cb | specific heat capacity of grain bulk, JKg-1K-1 |
| Def | effective diffusivity of water vapour in intergranular air, m2s-1 |
| G | incident solar radiation, Wm-2 |
| hc | convective heat transfer coefficient, Wm-2K-1 |
| K | grain permeability, m2 |
| L | bin height, m |
| n | normal direction |
| pv | partial pressure of water vapour, Pa |
| Ra | Rayleigh number of porous media,  bin radio, m bin radio, m |
| r, z | cylindrical coordinates, m |
| t | time, s |
| T | temperature, °C, K |
| V | wind speed, ms-1 |
| Wg | grain moisture content, d.b |
| Greek Symbols | |
| α | solar surface absorptivity |
| αef | effective thermal diffusivity of porous media (m2s-1) |
| ξ | emissivity |
| Γ | boundary domain |
| η | change in the partial pressure due to change in the moisture content at constant T, Pa |
| ρb | grain bulk density , kgm-3 |
| ω | change in the partial pressure due to change in the temperature at constant W, PaK-1 |
| ψ | stream function (m3-1) |
| Ω | domain |
| μ | viscosity of air (kg ms-1) |
| σ | Stefan-Boltzmann's constant, Wm-2 K-4 |
| Subscripts | |
| b | grain bulk |
| hs | headspace |
| amb | ambient |
| s | sky |
| 0 | initial or reference value |
ACKNOWLEDGEMENTS
The authors like to acknowledge the following institutions: ANPCYT/FONCYT (PICT 2008 0460), National University Rosario (PID ING295) and INTAPRECOP: Postharvest Efficiency for the support.
REFERENCES
1. Abalone, R.M., A. Gastón, A. Cassinera and M.A. Lara, "Modelización de la distribución de la temperatura y humedad en granos almacenados en silos," Mecánica Computacional, 25, 233-247 (2006).
2. Alagusundaram, K., D.S. Jayas, N.D.G. White and W.E. Muir, "Three dimensional, finite element, heat transfer model of temperature distribution in grain storage bins," Trans. of ASAE, 33, 577-584 (1990).
3. Andrade, E., S.M. Couto, D. Queiroz and L. Faroni, "Three dimensional simulation of the temperature variation in corn stored in metallic bin," ASAE Annual Meeting., Paper N02-3150 (2002).
4. Arias Barreto, A., R.M. Abalone and A. Gastón, "Mathematical modeling of momentum, heat and mass transfer in grains stored in silos. Part I: model development and validation," Latin American Applied Researdh, XX, XX-XX (2013).
5. ASAE Standard D241.4, Density, Specific Gravity, and Mass-Moisture Relationships of Grain for Storage, ASAE, St Joseph, Mich (2003).
6. Balzi, U., A. Gastón and R.M. Abalone, "Efecto de la convección natural en la distribución de temperatura y migración de humedad en granos almacenados en silos," Mecánica Computacional, 26, 1471-1485 (2008).
7. Brooker, D., F.W. Bakker-Arkema and C.W. Hall, The Drying and Storage of Grains and Oilseeds, McGraw-Hill, Van Nostrand Reinhold, Avi Book, New York (1992).
8. Carrera-Rodríguez, M., G.M. Martínez-Gonzáles, J. Navarrete Bolaños, E. Botello Alvarez, R. Rico-Martínez and H. Jiménez-Islas, "Transient numerical study of the effect of ambient temperature on 2D cereal grain storage in cylindrical silos," J. of Stored Prod. Research, 47, 106-122 (2011).
9. Casada, M.E., F.H. Arthur and H. Akdogan, "Temperature monitoring and aeration strategies for stored wheat in the central plains," ASAE Annual Meeting., Paper N02-6116 (2002).
10. Duffie, J. and W. Beckman, Solar Engineering of Thermal Processes, John Wiley and Sons (1980).
11. Gastón, A., R. Abalone, R.E. Bartosik and J.C. Rodríguez, "Mathematical modelling of heat and moisture transfer of wheat stored in plastic bags (silo-bags)," Biosystems Eng., 104, 72-85 (2009).
12. Iqbal, M., An introduction to solar radiation, Academic Press (1983).
13. Jia, C., D.W. Sun and C. Cao, "Finite element prediction of transient temperature distribution in a grain storage bin," J. Agric. Engng Res ,76, 323330 (2000).
14. Jia, C., D.W. Sun, and C. Cao, "Computer simulation of temperature changes in wheat storage bin," J. of Stored Prod. Research, 37, 165-177 (2001).
15. Jiang, S. and J.C. Jofriet, " Finite element prediction of silage temperature in tower silo," Trans. of ASAE, 30, 1744-1750 (1987).
16. Khankari, K.K., R.V. Morey and S.V. Patankar, "Application of a numerical model for prediction of moisture migration in stored grain," Trans. of ASAE, 38, 1789-1804 (1995).
17. Khatchatourian, O.A. and F.A. Oliveira, "Mathematical modelling of air flow and thermal state in large aerated grain storage," Biosystem Eng., 95, 159169 (2006).
18. Kreith, F. "Principles of Heat Transfer," Trans. of ASAE, 33, 577-584 (1973).
19. Lopes, D.C., J.H. Martins, A.J. Steidle Netoa, A.F. Lacerda Filhoa, E.C. Melo and P.M.B. Monteiro, "Management of stored maize by AERO controller in five Brazilian locations: a simulation study," Biosystem Eng., 101, 325-330 (2008a).
20. Lopes, D.C., J.H. Martins, A.F. Lacerda Filho, E.C. Melo, P.M.B. Monteiro and D.M. Queiroz, "Aeration strategy for controlling grain storage based on simulation and on real data acquisition," Computers and Electronics in Agriculture, 63, 140-146 (2008b).
21. Lopes, D.C., J.H Martins, E.C. Melo and P.M.B. Monteiro, "Aeration simulation of stored grain under variable air ambient conditions," Postharvest Biology and Technology, 42, 115-120 (2006).
22. Martins, J.H., A.M. Mota, and J.A. Fonseca, "Simulation of an automatic controller for stored grain aeration systems," Engenhariana Agricultura, 9, 5570 (2001).
23. Mills, A.F., Transferencia de Calor, Editorial Irwin (1995).
24. Montross, D.M., Finite element modeling of storage grain ecosystem and alternative pest control techniques, Ph. D Thesis, Purdue University, West Lafayette, Indiana (1999).
25. Montross, D.M. and D.E. Maier, "A new moisture equilibrium theory to predict moisture movement in a non-aerated grain mass," AM ASAE, Paper016110 (2001).
26. Montross, D.M., D.E. Maier and K. Haghighi, "Development of a finite-element stored grain ecosystem model," Trans. of ASAE, 45, 1455-1464 (2002).
27. Navarro, S. and R. Noyes, The Mechanics and Physics of Modern Grain Aeration Management, CRC. Press (2002).
28. Sinicio, R. and W.E. Muir, "Comparison of mathematical models to simulate aeration of wheat stored in Brazil," J. Agricultural Eng. Research, 64, 119-130 (1996).
29. Sinicio, R. and W.E. Muir, "Aeration strategies for preventing spoilage of wheat stored in tropical and subtropical climates," Applied Eng. in Agriculture, 14, 512-527 (1998).
Tuantum chemical investigations of new conjugated compounds based on dithiobithiophene as solar cells materials
Y.A. Sadiki†, M. Hamidi‡, S.M. Bouzzine‡,§, L. Bejjit†,& , M. Haddad† and M. Bouachrine†,& *
† LASMAR, Faculté des Sciences, Université Moulay Ismail Meknès, Maroc
‡ URMM/UCTA, Faculté des Sciences et Techniques d'Errachidia, Université Moulay Ismaïl, Maroc
§ Regional Centre for Trades Education and Training, BP:8, Errachidia, Morocco
& ESTM, Université Moulay Ismail, Meknes, Maroc
* Corresponding authors: bouachrine@gmail.com
Abstract— Thanks to their specific properties, The research in the organic p-conjugated molecules and polymers has become one of the most interesting topics in the fields of chemistry physics and materials science., these compounds have become the most promising materials for the optoelectronic device technology such as solar cells. In this work, The theoretical ground-state geometry and electronic structure of the studied molecules were investigated by the DFT method at B3LYP level with 6-31G(d) basis set has been performed to explore the optical and electronic properties of a series of different compounds based on bithiophene. Different electron side groups were introduced to investigate their effects on the electronic structure. The effects of the ring structure and the substituents on the geometries and electronic properties of these materials were discussed with the aim to evidence the relationship between molecular structure and optoelectronic properties. The theoretical knowledge of the HOMO and LUMO energy levels of the components is basic in studying organic solar cells so the HOMO, LUMO, Gap energy and Voc (open circuit voltage) of the studied compounds have been calculated and reported. These properties suggest these materials as a good candidate for organic dye-sensitized solar cells.
Keywords— P-conjugated Molecules; Bithiophene; Organic Solar Cells; DFT; Low Band-gap; Electronic Properties; Voc (Open Circuit Voltage)
I. INTRODUCTION
Since their discovery, materials based on conjugated molecules have attracted continuing interest as a result of their suitability in a broad range of applications, such as batteries (Nalwa, 1999; Lim et al., 2006) , electroluminescent devices (Dimitrakopolous et al., 2002), field-effect transistors (Kraft et al., 1998; Kim et al., 2006) and photovoltaics (Manoj and Narayan, 2003; Wienk et al., 2003). Conjugated polymers containing carbazole or (and) thiophene moieties either in the main or side chains have attracted much attention because of their unique electronic properties, their high photoluminescence quantum efficiency, thermal stability and also their facile color tenability (Müllen et al., 1998; Cornil et al., 1998). Thanks to its important specific properties, these new compounds became the most promising materials for the optoelectronic device technology (Sariciftci et al., 1992). These properties depend on the degree of electronic delocalization in these materials and on the modification of chemical structure through the incorporation of charge carriers into the molecule backbone. One of the most important factors of controlling physical properties is the band gap, which is a current topic of research. In particular, organic materials with a low gap are desired in optoelectronic applications. Many ways have been used to modulate this parameter the best one is the modification of chemical structure through the incorporation of charges carriers in the polymer backbone. Most of recent papers have focused on the synthesis of short-chain conjugated compounds. These compounds became the most promising materials for the optoelectronic device technology (Brabec et al., 2001a; Zhou et al., 2007). Recent work in this area has been focused on the synthesis and design of new molecules combining donor and acceptor blocks, or conjugated systems with narrow band gaps (Cravino and Sariciftci, 2002; Roquet et al., 2006). In order to obtain materials with more predominant capability, the development of novel structures is now being undertaken following the molecular engineering guidelines, theoretical studies on the electronic structures of these materials have made great contributions to the rationalization of the properties of known onesand the prediction those of unknown ones (Bouzakraoui et al., 2006; Mondal et al., 2010; Bundgaard et al., 2007). We note that theoretical knowledge of the HOMO and LUMO energy levels of the components is crucial in studying organic solar cells. So, we can save time and money in choosing the adequate organic materials to optimize photovoltaic devices properties. The HOMO and LUMO energy levels of the donor and of the acceptor components for photovoltaic devices are very important factors to determine whether effective charge transfer will happen between donor and acceptor. The offset of band edges of the HOMO and LUMO levels will prove responsible for the improvement of all photovoltaic properties of the organic solar cells.
A better understanding of the electronic and optical properties of these materials requires knowledge of their conformations and electronic structures. More importantly, these properties depend on the degree of electronic delocalization in these materials and on the modification of chemical structure through the incorporation of charge carrier. On the other hand, theoretical calculations provide a lot of useful information that help chemists to build up a good relationship between structure and properties of these materials. Theoretical analysis on the electronic structures of various conjugated polymers and oligomers has been extensively reported (Zgou et al, 2008). We have successfully used the DFT method to predict properties of polythiophene and polyparaphenylene (Bouzakraoui et al., 2005; Bouzzine et al., 2008).
In this study, the theoretical analysis on the geometries and electronic properties of conjugated compound based on bithiophene (M1, M2, M3 and M4) is reported, as shown in Fig. 1. The central dithienothiophene is attached through conjugation to either two donor (carbazole for M1 or N,N-diphenylamine for M3) forming D-p-D or an acceptor at the ends (2-phenyl-5-(4-tert-butyl)1,3,4-oxadiazole) forming M2 and M4). These new series of organic compounds have been successfully recently synthesized (Kim et al., 2000). The theoretical ground-state geometry and electronic structure of the studied molecules were investigated by the DFT method at B3LYP level with 6-31G(d) basis set. The effects of the ring structure and the substituents on the geometries and electronic properties of these materials were discussed with the aim to evidence the relationship between molecular structure and optoelectronic properties. This investigation was used to drive next syntheses towards compounds more useful as active materials in optoelectronic. The theoretical knowledge of the HOMO and LUMO energy levels of the components is basic in studying organic solar cells so the HOMO, LUMO and Gap energy Voc (open circuit voltage) of the studied compounds have been calculated and reported.
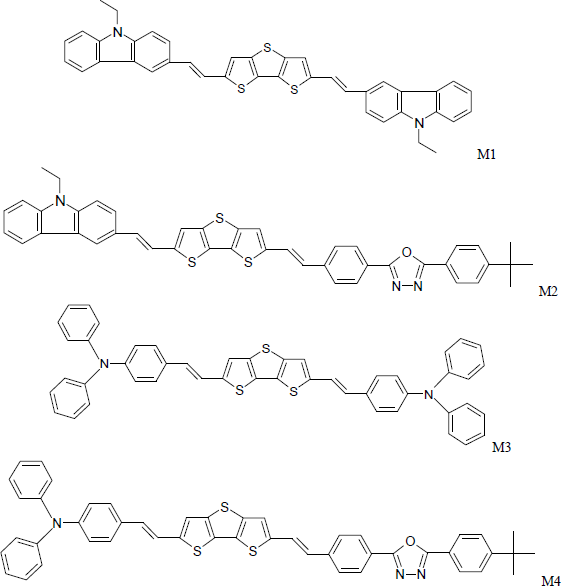
Figure 1: The sketch map of studied structures
II. THEORETICAL METHODOLOGY
DFT method of three-parameter compound of Becke (B3LYP) (Mikroyannidis et al., 2011) was used in all the study of the neutral and polaronic compounds. The 6-31G(d) basis set was used for all calculations (Ditchfield et al., 1971; Hehre et al., 1972; Hariharan and Pople, 1974; Gordon., 1980). To obtain the charged structures, we start from the optimized structures of the neutral form. The calculations were carried out using the Gaussian 03 program (Frisch et al., 2009). The geometry structures of neutral and doped molecules were optimized under no constraint. We have also examined HOMO and LUMO levels; the energy gap is evaluated as the difference between the HOMO and LUMO energies. The ground state energies and oscillator strengths were investigated using the ZINDO/s, calculations on the fully optimized geometries. In fact, these calculation methods have been successfully applied to other conjugated molecules and polymers (Meille et al., 1994).
III. RESULTS AND DISCUSSION
A. Molecular design and geometry structures
The chemical structures of all studied molecules in this work are displayed in Fig. 1. All the molecular geometries have been calculated with the hybrid B3LYP function combined with 6-31G(d) basis sets using Gaussian 03 program suite. The calculated bond lengths of molecules 1 and 1c are listed in Table 1. For each model seven inter-ring bond lengths di (with i = 1, 2, 3, 4, 5, 6 or 7) which greatly contribute to the internal energy, were compared in table 1. It was found in other works (Bouachrine et al., 2011) that the DFT-optimized geometries were in excellent agreement with the data obtained from X-ray analyses.
Table 1: Geometrical parameters of study compounds C1 to C6 obtained by B3LYP/6-31G(d,p) in their neutral states.
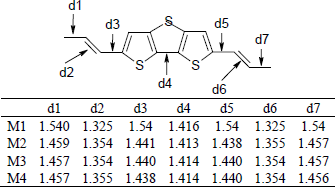
We note firstly a slight increase of the inter-ring double bonds d2 and d6 but on the other hand a slight decrease in the inter-ring simple bonds d1, d3, d5 and d7 is observed going from M1 to M4. This is probably due to greater extension of conjugation in the case of compound M4. These modifications can explain the gap variations found in Table 3. On the other hand, the replacement of the carbazole unit by the N,N-diphenylamine unit leads to a smaller inter-ring simple bonds (d1, d3, d5 and d7) and highest iner-ring double bonds (d2 and d6). This indicates that the N,N-diphenylamine substitution significantly enhances conjugation of the oligomer structure both in all cases.
Table 2: Geometrical parameters of compound M4 obtained by B3LYP/6-31G(d,p) in their doped states.
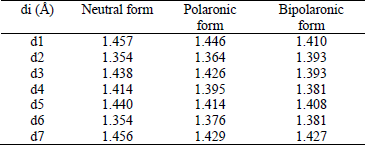
Table 3: Values of HOMO (eV), LUMO (eV) and Eg (eV) energies calculated for M1, M2, M3 and M4.
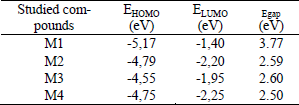
Indeed, in this D-π-A (D) system, the π-conjugated group is employed as the bridge of intramolecular charge transfer. Thus the bond length between donor moiety and acceptor π-spacer and between π-spacer and acceptor group can elucidate the real interaction in the system. Indeed, a short bond length favors the intramolecular charge transfer. Data in table1 show that d2 and d6 are the shortest bonds, these bonds show more C=C character especially for all studied compounds. These results indicate that the connection of the terminal electron-donating amino groups (N,N-diphenylamine unit) to the electron-accepting (2-phenyl-5-(4-tert-butyl)1,3,4-oxadiazole) via π-bridge (dithienothiophene) is crucial for highly-enhanced ICT character, which is important to make absorption spectra red shift
On the other hand, it is interesting to study how the p-doped π-conjugated molecule becomes the ultimate responsible of charge transport. As said before, to obtain oxidized optimized structure, we started from the optimized structure of the neutral form. We can conclude that during the doping process and for all studied compounds the simple bonds become shorter (d1, d3, d5 and d7), while the double ones (d2 and d6) become longer. The inter-rings bonds are longer than normal double bonds. A quinoid-like distortion emerges as a result of the oxidation. These results are consistent with the ab-initio HF and DFT calculations performed by Casado et al. (1999) and Bouzzine et al. (2005) for substituting oligothiophenes. The optimized geometry of the cationic compound indicates the formation of the positive) polaron defect localized in the middle of the molecule and extending over the adjacent repeat units. The charged species are characterized by a reversal of the single double C¾C bond pattern; the geometry process thus induces the appearance of a strong quinoid character within the molecule.
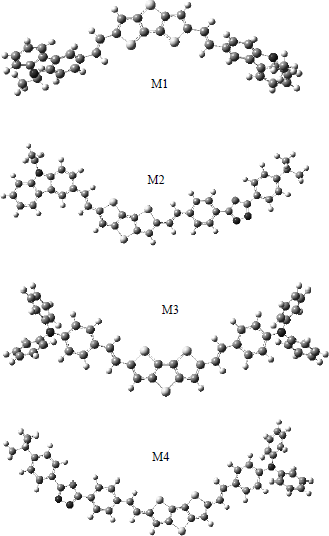
Figure 2: Optimized structures of studied oligomers (M1, M2, M3 and M4)
B. Opto-electronic properties
It is important to examine the HOMO and the LUMO for these oligomers because the relative ordering of occupied and virtual orbital provides a reasonable qualitative indication of excitation properties (Yang et al., 2005) . In general, and as plotted in Fig. 3 (LUMO, HOMO); the HOMO possesses an antibonding character between the consecutive subunits. On the other hand, the LUMO of all oligomers generally shows a bonding character between the subunits.
Figure 3: The contour plots of HOMO and LUMO orbitals of the studied compounds M1, M2, M3 and M4.
The experiment showed that the HOMO and LUMO energies were obtained from an empirical formula based on the onset of the oxidation and reduction peaks measured by cyclic voltametry. But in the theory, the HOMO and LUMO energies can be calculated by DFT calculation (Bredas et al., 2010). However, it is noticeable that solid-state packing effects are not included in the DFT calculations, which tend to affect the HOMO and LUMO energy levels in a thin film compared to an isolated molecule as considered in the calculations. Even if these calculated energy levels are not accurate, it is possible to use them to get information by comparing similar oligomers or polymers.
Electronic structures are fundamental to interpretation and understanding of the absorption spectra. The calculated frontier orbital energies HOMO and LUMO and energy gaps between highest occupied molecular orbitals (HOMO) and lowest unoccupied molecular orbitals (LUMO) are listed in Table 3. As shown in Table 3, the calculated electronic parameters (Gap, LUMO, HOMO) of compounds M4, M1, M2, M3 and M4 are (3.77 eV, -1.405 eV, -5.176 eV); (2.595 eV, -2.201 eV, -4.796 eV) ; (2.6012 eV, -1.953 eV, -4.554 eV) and(2.505 eV, -2.2519 eV, -4.757 eV) respectively. Comparing molecules M1, M2, M3 and M4 the increased ICT characters make the energies of HOMO and LUMO stabilized and the energy gaps between HOMO and LUMO decrease, which would make the OPA spectra red shifted. The order of energy gaps between HOMO and LUMO is: M4(2.5054eV) < M2(2.595eV) < M3(2.601eV) < M1(3.77eV).
The comparison between the energies of two symmetric D-π-D compounds (M1 and M3) on the one hand, and between those of the asymmetric ones D-π-A (M2 and M4) on the other hand, we note that the Energy Gap decreases when going from M1 to M3, and from M2 to M4. This is probably due to the effect of electro-donor groups N,N- diphenyl amine which is stronger than that of carbazole group. The compounds M2 and M4 exhibit destabilization of the HOMO and stabilization of the LUMO levels in comparison with those of M1 and M2 respectively due to the stronger electron-donating ability of N,N-diphenyl group than the carbazole group. Finally, the energy gap of M4 is much smaller than that of the other compounds. This may be attributed to the strong electron-donating N,N-diphenyl amine side groups and also to the connection of the terminal electron-donating amino groups (N,N-diphenylamine unit) to the electron-accepting (2-phenyl-5-(4-tert-butyl)1,3,4-oxadiazole) via the π-bridge (dithienothiophene DTT). Molecule 4 with this lowest energy gap is expected to have the most outstanding photophysical properties.
C. Photovoltaic properties
Generally, the most efficient material solar cells are based on the bulk hetero-junction structure of the blend of p-conjugated molecule or polymer donors and fullerene derivative acceptors (Derouiche and Djara, 2007; Zhang et al., 2008; Gunes et al., 2007; Dennler et al., 2009). Here, we studied the photovoltaic properties of the compounds Mi as donor blended with [6.6]-phenyl-C61-butyric acid methyl ester (PCBM), which is the most broadly used as an acceptor in solar cell devices.
The HOMO and the LUMO energy levels of the donor and acceptor components are very important factors to determine whether effective charge transfer will happen between donor and acceptor. Figure 3 shows detailed data of absolute energy of the frontier orbitals for studying compounds and PCBM (C60) is included for comparison purposes. It is deduced that the nature of donor or acceptor pushes up/down the HOMO/LUMO energies in agreement with their electron character. To evaluate the possibilities of electron transfer from the excited studied molecules to the conductive band of PCBM, the HOMO and LUMO levels were compared.
As shown in Fig. 3, both HOMO and LUMO levels of the studied molecules agreed well with the requirement for an efficient photosentizer. On the one hand, the difference in the LUMO energy levels of the studied compounds Mi and PCBM was in the range of 0.90eV, suggesting that the photoexcited electron transfer from Mi to PCBM may be sufficiently efficient to be useful in photovoltaic devices (He et al., 2010; Kooistra et al., 2007). On the other hand, the power conversion efficiency (PCE) was calculated according to the following equation:
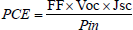
where Pin is the incident power density, Jsc is the short-circuit current, Voc is the open-circuit voltage, and FF denotes the fill factor).
The maximum open circuit voltage (Voc) of the BHJ solar cell is related to the difference between the highest occupied molecular orbital (HOMO) of the electron donor and the LUMO of the electron acceptor, taking into account the energy lost during the photo-charge generation (Gadisa et al., 2004; Scharber et al., 2006; Brabec et al., 2001b). The theoretical values of open-circuit voltage Voc have been calculated from the following expression:

The difference between the energy of conduction band (LUMO) of PCBM and the energy of HOMO of the studied molecules range from 1.028eV to 1.650eV, these values is sufficient for a possible efficient electron injection. Therefore, all the studied molecules can be used as sensitizers because the electron injection process from the excited molecule to the conduction band of PCBM and the subsequent regeneration is possible in an organic sensitized solar cell.
D. Absorption and emission properties
Based on the optimized molecular structures with B3LYP/6-31G(d) method. We have calculated the UV-vis spectra of the studied compounds M1, M2, M3 and M4 using ZINDO/s method. As illustrated in table 5, we can find the values of calculated wavelength λmax and oscillator strengths O.S excitation to the S1 state corresponds almost exclusively to the promotion of an electron from the HOMO to the LUMO orbital. The absorption wavelengths arising from S0→S1 electronic transition increase progressively with the increasing of conjugation lengths. It is reasonable, since HOMO→LUMO transition is predominant in S0→S1 electronic transition; the results are a decrease of the LUMO and an increase of the HOMO energy. These values are calculated by ZINDO method starting with optimized geometry obtained at B3LYP/6-31G(d) level. Data in table3 shows that there is a bathochromic shift when passing from M1 to M4 in this order (M1, M3, M2, M4) which also can be seen respectively in M1 (465.30 nm), M3 (539,48 nm), M2 (542.45 nm), M4 (544.03 nm). This effect is obviously due to insertion of different donor or acceptor to the π-spacers unit. Those interesting points are seen both in the theoretical and experimental results.
Table 4: Energy values of ELUMO (ev), EHOMO (ev) and the open circuit voltage Voc (ev).
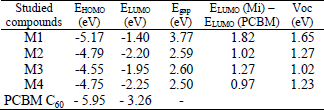
Table 5: Absorption Wavelength λmax (nm) and Oscillator Strengths (O.S.) obtained by the ZINDO/B3LYP/6-31(d) method.
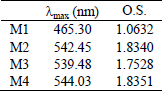
For all studied compounds, these absorptions peaks between 465 nm and 544 nm are assigned to the ICT transition from Donor to acceptor or from donor to the π-spacers moiety. Comparing compounds (D-p-D) M1 and M3, the ICT transition shifts from 465.30 nm to 539.48 nm because the N,N-diphenylamine unit moiety has stronger electron-donating ability than the carbazole moiety.
Table 6: Emission Wavelength λmax (nm) and Oscillator Strengths (O.S.) obtained by the ZINDO/B3LYP at CIS/3-21 method.
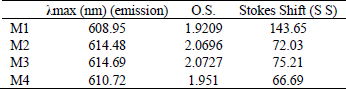
Comparing compounds (D-p-A) M2 and M4, the ICT transition shifts from 542.45 nm to 544.05 because the contribution of electron-withdrawing of (2-phenyl-5-(4-tert-butyl)1.3.4-oxadiazole) to the donor moiety of N,N-phenylamine in compound M4 is stronger than that of electron-donating group of carbazole. This could be explained further by the electrochemistry measurement.
In order to study the emission photoluminescence properties of the studied compounds Mi, the ZINDO/B3LYP method was applied to the geometry of the lowest singlet excited state optimized at the CIS level with 3- 21G⁄ basis set (Kato et al., 2006). The normalized photoluminescence (PL) spectrum of the studied compounds shows a maximum at 608.95 nm with strongest intensity (f=1.892) for M1; 614.48 (2.069) for M2; 614.69 (2.072) for M3 and 610.72 (1.951) for M4. This could be regarded as an electron transition process that is the reverse of the absorption corresponding mainly to the LUMO-HOMO electron transition configuration. Moreover, the observed red-shifted emission of the PL spectra is in reasonable agreement with the obtained results of absorption. We can also note that relatively high values of Stokes Shift (SS) are obtained for M4 (172 nm). In fact, the stokes shift, which is defined as the difference between the absorption and emission maximums (EVA-EVE), is usually related to the band widths of both absorption and emission bands (Yu et al., 2003).
IV. CONCLUSION
In this study, the quantum chemical investigation on the geometries and electronic properties of various compound based on dithiobithiophene is performed in order to display the effect of molecular structure on the opto-electronic properties of these materials. The concluding remarks are:
The results of the optimized structures for all studied compounds so that they have similar conformations (quasi planar conformation). We found that the modifications of several groups Donor or Acceptor does not change the geometric parameters.
During the doping process and for all studied compounds the simple bonds become shorter, while the multiple ones become longer. The inter-rings bonds are longer than normal double bonds. A quinoid-like distortion emerges as a result of the oxidation
Besides the agreement between theoretical and experimental results, the replacement of carbazole group by the N,N-diphenyl group thiophene leads to the destabilisation of the HOMO level and the stabilisation of the LUMO level with a decreasing of the energy Gap and a red shifting in the absorption spectrum
The calculated frontier orbital energies HOMO and LUMO and energy gaps showed that the energy gaps of the studied molecules differ slightly from 3.77 eV to 2.505 eV depending on the different structures. The calculated band gap Egap of the studied compound increases in the following order M1> M3> M2> M4.
All the studied molecules can be used as sensitizers because the electron injection process from the excited molecule to the conduction band of PCBM and the subsequent regeneration are feasible in the organic sensitized solar cell.
This calculation procedure can be used as a model system for understanding the relationships between electronic properties and molecular structure and also can be employed to explore their suitability in electroluminescent devices and in related application. Presumably, the procedures of theoretical calculations can be employed to predict and assume the electronic properties on yet prepared and efficiency proved the other materials, and further to design novel materials for organic solar cells.
ACKNOWLEDGEMENTS
This work was supported by Volubilis Program (N° MA/11/248), and the convention CNRST/CNRS (Project chimie1009). We are grateful to the "Association Marocaine des Chimistes Théoriciens" (AMCT) for its pertinent help concerning the programs
REFERENCES
1. Bouachrine, M., A. Echchary, S.M Bouzzine, M. Amine, M. Hamidi, A. Amine and T. Zair. "Oligothiophenes bridged by silicon groups, DFT study of structural and electronic properties," Phys. Chem. News, 58, 61-66 (2011).
2. Bouzakraoui, S., S.M. Bouzzine, M. Bouachrine and M. Hamidi, "Density functional theory study of conformational and opto-electronic properties of oligo-para-phenylenes," J. Mol. Struct. (Theochem), 725, 39-44 (2005).
3. Bouzakraoui, S., S.M. Bouzzine, M. Bouachrine and M. Hamidi, "Theoretical investigation of electroluminescent alkoxy substituted 4,4'-bis (2-phenylethenyl) biphenyls as guest in blue OLEDs," Sol. Energy Mater. Sol. Cells, 90, 1393-1402 (2006).
4. Bouzzine, S.M., S. Bouzakraoui, M. Bouachrine and M. Hamidi, "Density functional theory (B3LYP/6-31G*) study of oligothiophenes in their aromatic and polaronic states," J. Mol. Struct. (Theochem), 726, 271-276 (2005).
5. Bouzzine, S.M., A. Makayssi, M. Hamidi and M. Bouachrine, "Bridging effect on structural and optoelectronic properties of oligothiophene," J. Mol. Struct. (Theochem), 851, 254-264 (2008).
6. Brabec, C.J., N.S. Sariciftci and J.C. Hummelen, "Plastic Solar Cells," Adv. Func. Mater., 11, 15-26 (2001a).
7. Brabec, C.J., A. Cravino, D. Meissner, N.S. Sariciftci, T. Fromherz, M.T. Rispens, L. Sanchez and J.C. Hummelen, "Origin of the open circuit voltage of plastic solar cells." Adv. Funct. Mater., 11, 374-380 (2001b)
8. Bredas, J.-L., M.D. McGehee and Z. Bao, "Thiophene-rich fused-aromatic thienopyrazine acceptor for donor-acceptor low band-gap polymers for OTFT and polymer solar cell applications," J. Mater. Chem., 20, 5823-5834 (2010).
9. Bundgaard, E. And F.C. Krebs, "Low band gap polymers for organic photovoltaics," Sol. Energy Mater. Sol. Cells, 91,954-985 (2007).
10. Casado, J., V. Hernàndez, F.J. Ramirez and J.T. López Navarrete, "Ab initio HF and DFT calculations of geometric structures and vibrational spectra of electrically conducting doped oligothiophenes," J. Mol. Struct. (Theochem), 463, 211-216 (1999).
11. Cornil, J., D. Beljonne, J.L. Brédas, K. Mûllen and G. Wegner, Electronic Materials: The oligomers Approach, Wiley-VCH, Weinheim, New York, 432-447 (1998).
12. Cravino, A. and N.S. Sariciftci,"Double-cable polymers for fullerene based organic optoelectronic applications," J. Mater. Chem., 12, 1931-1943 (2002).
13.Dennler, G., M.C. Scharber and C. Brabec, "Polymer-Fullerene Bulk-Heterojunction Solar Cells," Adv. Mater., 21, 1323-1338 (2009).
14. Derouiche, H. and V. Djara,"Impact of the energy difference in LUMO and HOMO of the bulk heterojunctions components on the efficiency of organic solar cells," Sol. Energy Mater. Sol. Cells, 91, 1163-1167 (2007).
15. Dimitrakopolous, C.D. and P.R.L. Malenfrant, "Organic Thin Film Transistors for Large Area Electronics," Adv. Mater., 14, 99-117 (2002).
16. Ditchfield, R., W.J. Hehre and J.A. Pople, "Self-Consistent Molecular-Orbital Methods. IX. An Extended Gaussian-Type Basis for Molecular-Orbital Studies of Organic Molecules," J. Chem. Phys., 54, 724-728 (1971).
17. Frisch, M.J., G.W. Trucks, H.B. Schlegel, G.E. Scuseria, M.A. Robb, J.R. Cheeseman, R.G. Scalmani, V. Barone, B. Mennucci, G.A. Petersson, H. Nakatsuji, M. Caricato, X. Li, H.P. Hratchian, A.F. Izmaylov, J. Bloino, G. Zheng, J.L. Sonnenberg, M. Hada, M. Ehara, K. Toyota, R. Fukuda, J. Hasegawa, M. Ishida, T. Nakajima, Y. Honda, O. Kitao, H. Nakai, T. Vreven, J.A. Montgomery, J.E. Peralta, F. Ogliaro, M. Bearpark, J.J. Heyd, E. Brothers, K.N. Kudin, V.N. Staroverov, R. Kobayashi, J. Normand, K. Raghavachari, A. Rendell, J.C. Burant, S.S. Iyengar, J. Tomasi, M. Cossi, N. Rega, J.M. Millam, M. Klene, J.E. Knox, J.B. Cross, V. Bakken, C. Adamo, J. Jaramillo, R. Gomperts, R.E. Stratmann, O. Yazyev, A.J. Austin, R. Cammi, C. Pomelli, J.W. Ochterski, R.L. Martin, K. Morokuma, V.G. Zakrzewski, G.A. Voth, P. Salvador, J.J. Dannenberg, S. Dapprich, A.D. Daniels, O. Farkas, J.B. Foresman, J.V. Ortiz, J. Cioslowski and D.J. Fox, Gaussian 09, Gaussian Inc., Wallingford, CT, (2009).
18. Gadisa, A., M. Svensson, M.R. Andersson and O. Inganas, "Correlation between oxidation potential and open-circuit voltage of composite solar cells based on blends of polythiophenes/ fullerene derivative," Appl. Phys. Lett., 84, 1609-1611 (2004).
19. Gordon, M.S., "The isomers of silacyclopropane," Chem. Phys. Lett., 76, 163-168 (1980).
20. Gunes, S., H. Neugebauer and N.S. Sariciftci, "Conjugated Polymer-Based Organic Solar Cells," Chem. Rev., 107, 1324-1338 (2007).
21. Hariharan, P.C. and J.A. Pople, "Self-consistent Perturbation Theory of Diamagnetism. I. A Gauge-Invariant LCAO (Linear Combination of Atomic Orbitals) Method for NMR Chemical Shifts," Mol. Phys., 27, 209-214 (1974).
22. He, Y.J., H.-Y. Chen, J.H. Hou and Y.F. Li, "Indene-C60 Bisadduct: A New Acceptor for High-Performance Polymer Solar Cells," J. Am. Chem. Soc., 132, 1377-1382 (2010).
23. Hehre, W.J., R. Ditchfield and J.A. Pople, "Self Consistent Molecular Orbital Methods. XII. Further Extensions of Gaussian Type Basis Sets for Use in Molecular Orbital Studies of Organic Molecules," J. Chem. Phys., 56, 2257-2261 (1972).
24. Kato, S., T. Matsumoto, M. Shigeiwa, H. Gorohmaru, S. Maeda, T. Ishii and S. Mataka, "Novel 2,1,3-Benzothiadiazole-Based Red-Fluorescent Dyes with Enhanced Two-Photon Absorption Cross-Sections," Chem. Eur. J., 12, 2303-2317 (2006).
25. Kim, O.-K., K.-S. Lee, H.Y. Woo, K.-S. Kim, G.S. He, J. Swiatkiewiczand and P.N. Prasad, "New Class of Two-Photon-Absorbing Chromophores Based on Dithienothiophene," Chem. Mater., 12, 284-286 (2000).
26. Kim, D.-H., J. Ohshita, K.-H. Lee, Y. Kunugi and A. Kunai, "Preparation of Monomeric LGa(NH2)2 and of LGa(OH)2 in the Presence of a N-Heterocyclic Carbene as HCl Acceptor," Organometallics, 25, 1511-1516 (2006).
27. Kraft, A., A.C. Grimsdale and A.B. Holmes, "Electroluminescent Conjugated Polymers-Seeing Polymers in a New Light," Angew. Chem. Int., 37, 402-428 (1998).
28. Kooistra, F.B., J. Knol, F. Kastenberg, L.M. Popescu, W.J.H. Verhees, J.M. Kroon and J.C. Hummelen, "Increasing the Open Circuit Voltage of Bulk-Heterojunction Solar Cells by raising the LUMO level of the Acceptor," Org. Lett., 9, 551-554 (2007).
29. Lim, E., B.-J. Jung, H.-K. Shim, T. Taguchi, B. Noda, T. Kambayashi,T. Mori, K. Ishikawa, H. Takezoe and L.-M. Do, "Nanoscale thin-film morphologies and field-effect transistor behavior of oligothio-phene derivatives," Org. Electron., 7, 121-131 (2006).
30. Manoj, A.G. and K.S. Narayan, "Photovoltaic properties of polymer p-n junctions made with P3OT/BBL bilayers," Opt. Mater., 21, 417-420 (2003).
31. Meille, S.V., A. Farina, F. Bezziccheri and M.C. Gallazi, "The influence of alkoxy side chains on the conformational flexibility of oligo- and polythiophenes,"Adv. Mater., 6, 848-851 (1994).
32. Mikroyannidis, J.A., D.V. Tsagkournos, P. Balraju and G.D. Sharma, "Cubic titanium dioxide photoanode for dye-sensitized solar cells," Journal of Power Sources, 196, 4143-4152 (2011).
33. Mondal. R., H.A. Becerril, E. Verploegen, D. Kim, J.E. Norton, S. Ko, N. Miyaki, S. Lee, M.F. Toney, J.-L. Bredas, M.D. McGehee and Z. Bao, "Thiophene-rich fusedaromatic thienopyrazine acceptor for donor-acceptor low band-gap polymers for OTFT and polymer solar cell applications," J. Mater. Chem., 20, 5823-5834 (2010).
34. Müllen, K. and G. Wegner, Electronic Materials: The Oligomers Approach, Wiley-VCH, Weinheim, New York, 105-197 (1998).
35. Nalwa, H.S., Handbook of Organic Conductive Molecules and Polymers," John Wiley & Sons (1999).
36. Roquet, S., A. Cravino, P. Leriche, O. Aleveque, P.Frere and J. Roncali, "Triphenylamine- Thienylenevinylene Hybrid Systems with Internal Charge Transfer as Donor Materials for Heterojunction Solar Cells," J. Am. Chem. Soc., 128, 3459-3466 (2006).
37. Sariciftci, N.S., L. Smilowitz, A.J. Heeger and F. Wudl, "Photoinduced electron transfer from a conducting polymer to Buckminster fullerene," Science, 258, 1474-1476 (1992).
38. Scharber, M.C., D. Mühlbacher, M. Koppe, P. Denk, C. Waldauf, A.J. Heeger and C.J. Brabec, "Design Rules for Donors in Bulk-Heterojunction Solar Cells-Towards 10% Energy-Conversion Efficiency," Adv. Mater., 18, 789-794 (2006).
39. Wienk, M.M., J.M. Kroon, W.J.H. Verhees, J. Knol, J. C. Hummelen, P.A. van Hal and R.A.J. Janssen, "Efficient Methano/70/Fullerene/MDMO-PPV Bulk Heterojunction Photovoltaic Cells," Angew. Chem. Int., 42, 3371-3375 (2003).
40. Yang, L., J. Feng and A. Ren, "Theoretical studies on the electronic and optical properties of two thiophene-fluorene based π-conjugated copolymers," Polymer, 46, 10970-10981 (2005).
41. Yu, J.-S.K., W.-C. Chen and C.-H. Yu, "Time-Dependent Density Functional Study of Electroluminescent Polymers," J. Phys. Chem. A, 107, 4268-4275 (2003).
42. Zgou, H., S. M. Bouzzine, S. Bouzakraoui, M. Hamidi and M. Bouachrine, "Theoretical study of structural and electronic properties of oligo(thiophene-phenylene)s in comparison with oligothiophenes and oligophenylenes," Chinese Chemical Letters, 19, 123-126 (2008).
43. Zhang, Q. Zhang, H. Ren, H. Yan, J. Zhang, H. Zhang and J. Gu, "Calculation of band gap in long alkyl-substituted heterocyclic-thiophene-conjugated polymers with electron donor-acceptor fragment," Sol. Energy Mater. Sol. Cells, 92, 581-587 (2008).
44. Zhou, Y., P. Peng, L. Han and W. Tian, "Novel donor-acceptor molecules as donors for bulk heterojunction solar cells," Synth. Met., 157, 502-507 (2007).
Received: July 19, 2012
Accepted: December 3, 2012
Recommended by Subject Editor: Marí Lujá Ferreira
