


Servicios Personalizados
Articulo
 pdf en Inglés
 Articulo en XML
 Referencias del artículo
 Permalink
Latin American applied research
versión On-line ISSN 1851-8796
Lat. Am. appl. res. vol.43 no.4 Bahía Blanca oct. 2013
Mathematical modelling of momentum, heat and mass transfer in grains stored in silos. Part I: model development and validation
A. Arias Barreto†, R. Abalone†,‡and A. Gastón†,§
† FCEIyA, Universidad Nacional de Rosario, Av. Pellegrini 250, 2000 Rosario, Argentina. abarreto@fceia.unr.edu.ar
‡ Instituto de Física Rosario (CONICET-UNRosario), 27 de Febrero 210 bis, 2000 Rosario,Argentina rabalone@fceia.unr.edu.ar
§ CIC-UNR, FCEIyA, Universidad Nacional de Rosario, Av. Pellegrini 250, 2000 Rosario, Argentina analiag@fceia.unr.edu.ar
Abstract— A bidimensional finite element model that predicts temperature distribution, moisture migration and natural convection currents in stored grain is described. Validation was performed by comparing predicted and measured variables under laboratory conditions in corn and wheat. On average, standard errors were at most 1.7oC for temperature and 0.69 %w.b for moisture content. The sensitivity of the solution to variations in grain hygroscopic properties and to election of a sorption isotherm equation was examined. For a given temperature gradient, moisture migration was higher in soybean than in corn and wheat. As result of hygroscopic properties and permeability of grain, wheat exhibited the highest resistance to moisture migration.
Keywords— Grain Storage; Numerical Modelling; Natural Convection; Heat And Mass Transfer.
I. INTRODUCTION
Temperature and moisture content are the most important factors affecting the quality of grain during storage. The primary causes of grain spoilage are insects, mites and microflora activity, which are function of temperature and moisture content. As a general rule, reducing either or both of these variables by drying or aerating (cooling) the grain results in an enhanced grain storage environment. The storage of grains in silos involves periods where the evolution of temperature and moisture content depends on seasonal variation of climatic conditions (non-aerated periods) and others where ambient or refrigerated (chilled) air is forced to flow through the grain mass (aerated periods). Thus, maintaining the quality of properly harvested and dried grain during storage relies on understanding the momentum, heat and mass transfer processes that take place in the grain ecosystem.
A revision of published works can be found in Navarro and Noyes (2002). For storage during nonaerated periods, some researchers analyzed the heat and mass transfer process, considering only difussion in different grains: wheat (Alagusundaram et al., 1990; Jayas et al., 1994; Jia et al., 2001; Jian et al., 2005); sorghum (Abbouda et al., 1992a; 1992b); rice (Iguaz et al., 2004) and corn (Montross et al., 2002a; Al-Amri and Abbouda, 2004) among others. The effect of natural convection flows was addressed by Nguyen (1987), Dona and Stewart Jr. (1988), Smith and Sokhansanj (1990), Khankari (1992), Singh et al. (1993), Thorpe (1995), Jiménez-Islas et al. (2004). In general, these studies assumed simplified boundary conditions (imposed constant temperature) and analyzed the effect of flow inertia, silo aspect ratio, imposed temperature and temperature dependent thermal property of grain on temperature, moisture content and natural convection. Carrera-Rodríguez et al. (2011) studied the storage of sorghum as function of Raleigh number and aspect ratio considering the day-night cycle of ambient temperature. Montross et al. (2002a) investigated how accurately boundary conditions needed to be specified and what type of weather data (daily or hourly weather data, effect of wind speed and solar radiation) was required for modeling grain storage.
Most of the published models presented results for different grains such as wheat, corn, rice and sorghum considering the climatic conditions of North America or Brazil, in case of South America (Andrade et al., 2002). No references were found in the international literature regarding the simulation of heat and mass transfer in grain storage with or without aeration for the climatic conditions of Argentina for grains such as soybean, wheat and corn, which are the most intensive crop cultivars.
Bearing in mind the economical importance that grain production has for Argentina, a general study that aims to develop a comprehensive model for grain storage systems is currently under development. By use of these simulation models it is possible to predict the evolution of grain temperature and moisture content during storage periods without aeration as well as to evaluate aeration strategies for the climatic conditions of traditional and new agricultural areas of Argentina. Understanding how different combinations of initial grain condition, management practices and weather pattern affect grain storability is critical for farmers and grain industry.
The momentum, heat and moisture transfer model applied in present study is based on the work of Khankari (1992) and Montross et al. (2002a). The role of grain higroscopicity on moisture migration in stored grain was first discussed by Khankari (1992). Local thermodynamic equilibrium between the grain mass and interstitial air was assumed and by use of a sorption isotherm the moisture balance was converted into a "standard" transport equation. Moisture migration can be considered as a diffusive and convective transport of water vapour through the interstitial air of the grain bulk, where moist grain itself acts as a
In a first stage of the research project, a heat and mass transfer model was developed to analyze the storage conditions of wheat hold in hermetic bags (silobags), a new storage system widely adopted in Argentina. The model was validated by comparison of predicted grain temperature and moisture content with measured values carried out in farm level trials (Gastón et al., 2009). Moisture content (MC) showed higher discrepancy than temperature as result of the averaging sampling procedure and grain variability typically found in large grain masses. This model was further extended to include the prediction of O2 and CO2 concentration in the intergranular air, variables used to monitor grain storability in the silo-bag (Abalone et al., 2011a, 2011b). In the previous models, diffusion was the only transfer mechanism taken into account.
This is the second stage, in which natural convection flows were incorporated to the transport process. The study was divided in two parts, the first one devoted to the validation and sensibility analysis of the model and the second one to study the storage of soybean in Argentina.
The aim of present work was:
1. to validate the implemented momentum, heat and moisture content model with published experimental data of grain temperature and moisture migration under controlled laboratory conditions.
2. to carry out a sensibility analysis with respect to higroscopic properties of grain.
3. to compare by numerical simulation, migration in corn, wheat and soybean under the same laboratory conditions.
II. HEAT TRANSFER MODEL
A. Mathematical Model
The following assumptions were considered for development of momentum, heat and moisture balances:
1— grain bulk is modeled as an isotropic porous media with effective transport properties.
2— in a control volume, grain and intergranular air are in local thermodynamic equilibrium.
3— the air-vapour mixture behaves as an ideal gas
4— interstitial air flow was modeled by Darcy's law, as Darcy Number Da is about 10-8(Jiménez Islas et al. 1999).
5— Boussinesq's approximation is applied.
6— grain bed shrinkage is negligible.
7— accumulation of moisture in the air and moisture diffusion by grain to grain contact are negligible.
8— aerobic respiration of the grain ecosystem is modeled according to the complete combustion of a typical carbohydrate
 | (1) |
 | (2) |
 | (3) |
 | (4) |
 | (5) |
 | (6) |
 | (7) |
 sorption isotherm sorption isotherm | (8) |
 rate of CO2 production rate of CO2 production | (9) |
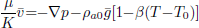
Equation (1) is the continuity equation and Eq. (2) is Darcy's law.
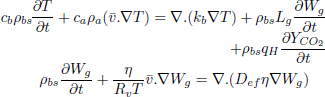
Equation (3) is the energy balance which includes two source terms. The first one states that grains act as a sink/source of moisture absorbing or releasing the latent heat of vaporization/condensation and the second one represents the heat released by respiration of the ecosystem.
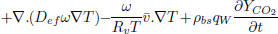
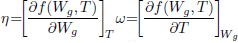
Equation (4) is the moisture balance where the contribution of moisture gradients, temperature gradients and moisture released by respiration to the overall transport process can be identified. In term, the contribution of temperature gradients to moisture transport process depends on ω while η affects the transport due moisture gradients and natural convection flows.
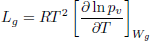
Both parameters, ω and η, depend on the higroscopic properties of grain (sorption isotherm, Eq. (8)). Expressions for model functions Lg, η, ω, are presented in detail in Gastón et al. (2009).
Correlations available in literature were used to model respiration rate of wheat (White et al., 1982) and corn (Bern et al., 2002) which are presented in a general form by Eq.(9). Model implementation is also given in Gastón et al. (2009).
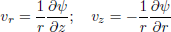
Using the definition of the stream function, continuity is satisfied and the momentum balance is determined. For axial symmetry the resulting expressions are:
 | (10) |
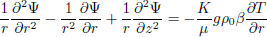 | (11) |
To complete the statement of the problem, boundary and initial conditions must be specified.
B. Model Validation.
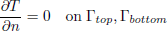
To validate the numerical model, predicted temperature and MC were compared with experimental results obtained by Khankari (1992) for corn and wheat. Figure 1 shows the diagram of the experimental setup. Two cylindrical barrels where filled with grain at 13%w.b initial MC. The top and bottom of the grain were thermally insulated and impermeable to moisture transfer. The barrels were placed in an insulated chamber kept at 0 to 4°C by forced convection of cool air. Hot water at 45 to 46°C was circulated through copper pipes located at the center line of each barrels. Temperatures along the radial direction at vertical sections A, B, C and D (Fig. 2) were recorded every hour by an electronic data logger. One barrel was opened after 10 days and the other after 20 days to remove the sample bags for moisture content determination. The above experiment was simulated by solving the momentum, heat and mass transfer model in two dimensional cylindrical coordinate system. For the energy balance, thermal insulation was assumed at the top and bottom of the barrel and constant temperatures Tin and Tout at the inner and outer wall, respectively. To model an impermeable condition to moisture transfer, a value of zero was specified for the stream function and for the normal gradient of water vapour pressure on the boundary domain Γ. Therefore, boundary conditions were expressed as:
 | (12) |
 | (13) |
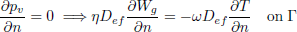 | (14) |
 | (15) |
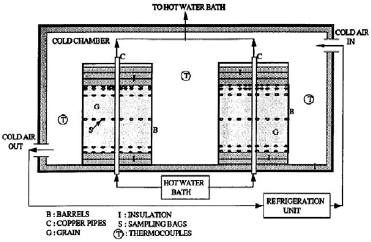
Figure 1: Schematic diagram of the experimental setup
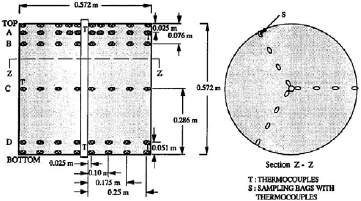
Figure 2: Schematic location of thermocouples and sampling bags (from Khankari et al., 1992)
The initial moisture content and temperatures distribution were assumed uniform
 | (16) |
Moisture dependent physical properties of corn and wheat were taken from Khankari (1992). Hygroscopic properties of grain were modeled with the Modified Henderson Thompson Isotherm (MHTI); sorptional constants are listed in Table 1.
Table 1. Modified Henderson Thompson constants
C. Numerical Solution.
The model was implemented in COMSOL Multiphysics 4.2a and solved by the Finite Element Method (FEM). The procedure to solve PDE by FEM is well documented and can be found in specific literature (Cook et al., 1989; Zienkiewicz and Taylor, 1989). For the numerical solution, COMSOL Multiphysics 4.2a defaults setting were applied: quadratic lagrangian elements, fourth order numerical quadrature, Backward Difference Formula (BDF) for time integration with a free time step. UMFPACK solver was selected to solve the PDE system (unsymmetrical multifrontal method and direct sparse LU factorization).
Analysis of mesh dependence of numerical results was performed for uniform meshes of 20x20 (M1), 40x40 (M2), 80x80 (M3), 160x160 (M4) elements. Calculations were carry out for a fixed time step of 1 hour and a free time step. Temperature and moisture content were compared at levels A, B, C and D. For both time steps, the maximum relative difference between results obtained with M4 and M1 were observed at level A. Richardson extrapolation was used to estimate the variables as the grid spacing tends to zero. The relative differences between the extrapolated and predicted values using M2 were 0.39% for temperature and 1.47% for moisture content, 0.11% and 0.48% using M3 and 0.03% and 0.12% using M4, respectively. Therefore, M3 and a free time step were selected to run the model.
III. RESULTS AND DISCUSSION
A. Predicted temperature and moisture content.
Temperature and MC distribution in corn after 10 and 20 days are presented in Fig. 3 and Fig. 4, respectively. Isotherm distributions shown in Fig. 3a and 3b are identical, so it can be concluded that after 10 days the grain reached a steady thermal state. The influence of natural convection flows circulating in a clockwise sense was not very strong as the isotherm distribution at the bottom and top of the barrel, slightly deviated from the pattern characteristic of a typical conductive process (lines parallel to the inner and outer walls).
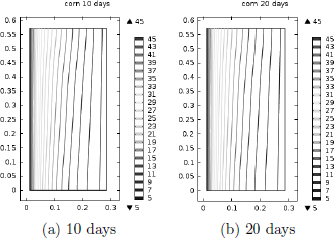
Figure 3: Isotherm distribution in corn predicted with K1=1.61x 10 -8m2 and (MHTI).
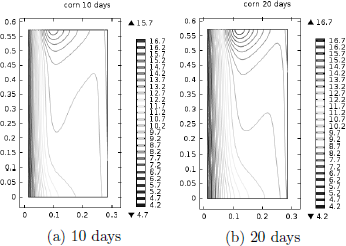
Figure 4: Moisture content isoline distribution predicted with K1=1.61x 10 -8m2 and (MHTI).
In contrast, Fig. 4a and 4b show that a steady MC distribution was not achieved. At the beginning, as result of the radial temperature gradients developed at the hot inner wall, moisture migrated by diffusion towards the interior, while on the other side, towards the cold outer wall. As natural convection flows developed, the accumulated MC at r~(0.08-0.10 m) was transported by the interstitial air creating a zone of higher MC at the top and a lower one at the bottom of the grain mass. Simulations results after 20 days showed that the outwardly radial flow at the top moved the wet spot towards the outer corner (not shown).
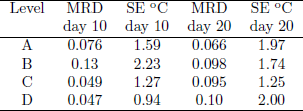
Predicted radial temperature and moisture content profiles at levels A, B, C and D after 10 and 20 days where compared with experimental data. The mean relative deviation (MRD) and standard error (SE) were used to determine the model accuracy. Results presented in Table 2 showed a better temperature agreement at locations C and D than at A and B. On average, total MRD was 0.083 and total mean SE 1.6°C.
Table 2: Temperature mean relative deviation (MRD) and standard error (SE) of the fit. K1=1.61x 10⁻⁸m2
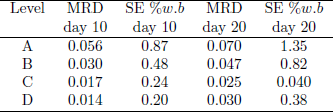
Mean relative deviation (MRD) and standard error (SE) for MC were listed in Table 3, again showing the best fit at C and D levels. At section A, by effect of convection transport, the model over predicted the amount of moisture accumulation, though in present study it was considerably lower than that predicted by Khankari et al. (1992). On average, total MRD was 0.036 and total mean SE 0.59 %w.b.
Table 3: MC mean relative deviation (MRD) and standard error (SE) of the fit. K1=1.61x 10⁻⁸m2
A simulation was also carried out for a permeability value of K2=3.59x10⁻⁹m2, proposed by Khankari, (1992) to improve their predictions. On average, total MRD and SE for temperature were very similar, 0.086 and 1.7°C, respectively. The amount of moisture accumulation was reduced at A and B locations, but predictions worsen at level D. Nevertheless, on average total MRD decreased to 0.040 and SE to 0.54 %w.b.
Predicted temperature at locations A, B C and D are plotted in Fig. 5 and MC profiles in Fig. 6.
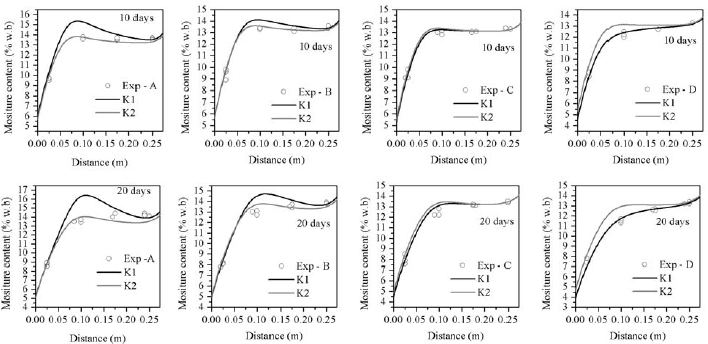
Figure 5: Comparison between measured and predicted moisture content distribution in corn; K1=1.61x10⁻⁸m2; K2=3.59x10⁻⁹m2
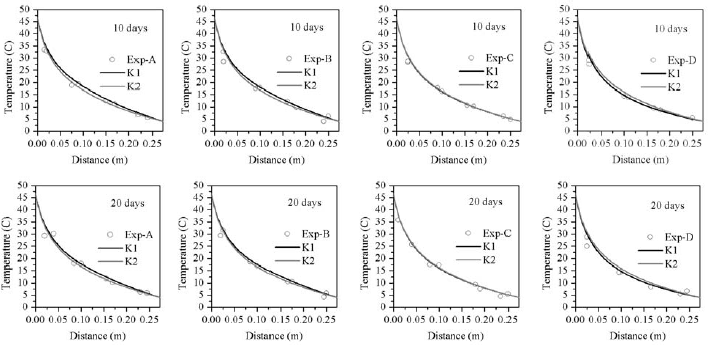
Figure 6: Comparison between measured and predicted temperature content distribution in corn; K1=1.61x10⁻⁸m2; K2=3.59x10⁻⁹m2
Good agreement between measured and predicted variables was obtained also for wheat (not shown).
For a permeability value of K1=5.96x10⁻⁹m2, average MRD for temperature was 0.065 and SE was 1.38°C; while 0.035 and 0.47 %w.b for MC. For a permeability value K2=2.55x10⁻⁹m2, resulted 0.066 and 1.40° for temperature, while 0.034 and 0.46 %w.b for MC.
It can be concluded that the numerical model satisfactorily predicted the heat transfer and moisture mi- gration in the grain bulk. Also the errors of present model were of the same order as those reported by other authors (Iguaz et al., 2004; Alagusundaram et al., 1990; Montross et al., 2002b).
B. Effect of hygroscopic properties of grains. Sensibility analysis.
The sensitivity of moisture migration to hygroscopic properties of grain was tested by running the model with a ± 10% change in the constants of the Modified Henderson Thompson Isotherm (MHTI), listed in Table 1 (base case). When dealing with biological products such variations are likely to appear.
Figure 7a compares MC profiles after 20 days at A and D levels for both permeability values. On average, the difference between extreme curves was at most of 2 %w.b points in the layer close to the hot wall where the steeper moisture gradients developed.
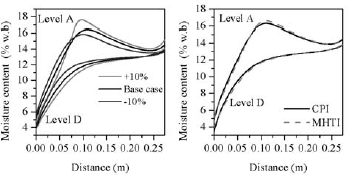
Figure 7: Sensitivity of predicted MC to higroscopic properties of grain after 20 days, at level A and D; a) Results using ±10% of MHTI constants; b) Comparison of predicted MC using MHTI and CPI; K1=1.61x 10⁻⁸m2
Another commonly used isotherm, Chung Pfost Isotherm (CPI), was also implemented to evaluate the differences that may arise in the results when it is applied. Chen and Morey (1989) presented sorption data for corn fitted to four different sorption isotherms. This information was used to run two simulations for the previous laboratory conditions. In the first, sorption data was modeled with (MHTI) and in the second, with (CPI). Comparison at levels A and D showed that predicted profiles almost overlapped, being the relative differences less than 2% (Fig.7b).
C. Comparison of moisture migration in wheat, corn and soybean under laboratory conditions
Figures 8a and 8b compare coefficients η and ω of wheat, corn and soybean as function of MC and temperature (10, 20 and 30°C), calculated by use of the Modified Henderson Thompson Isotherm. In the range 6-16 %w.b, the effective diffusivity of water vapour due to moisture gradients (η Def ) is higher for wheat than for corn and soybean (Fig. 8a). Therefore, steeper moisture gradients should be expected in bulk soybean and corn than in wheat.
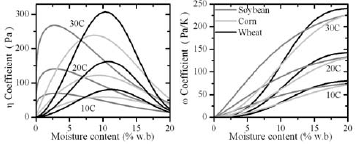
Figure 8: Variation of ? and ? with temperature and moisture content of grain bulk
On the other hand, for MC less than 13 %w.b, the effective diffusivity of water vapour due to temperature gradients (ωDef ) is higher for soybean while comparable for wheat and corn. The effect of temperature gradients was treated as a source or sink term in the moisture balance equation. In consequence to equilibrate with the surroundings soybean will liberate more moisture compared to corn and wheat.
For comparison, moisture migration in wheat, corn and soybean was analyzed for the previous laboratory conditions. One simulation was run considering moisture transfer only by diffusion and another including both diffusion + convection transport. When diffusion was the only transfer mechanism, MC distribution only depended on the radial coordinate. Thus, only MC profile after 20 days was plotted at location A (Fig. 9a). It was observed that in a layer 0.10 m width close to the inner wall, soybean presented the steeper MC gradient and higher MC changes while wheat exhibited more resistance to moisture migration.
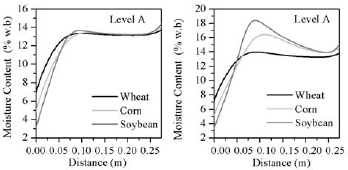
Figure 9: Comparison of moisture migration at level A in corn, wheat and soybean; a) Diffusion transport; b) Diffusion +convection transport
A slightly wet spot developed around r= 0.10 m where the MC peak ranged from 13.33%w.b (wheat) to 13.63% w.b (soybean). Fig. 9b compares moisture accumulation at level A when convection transport was included. MC pattern for wheat was very similar to the previous one (diffusion transfer) as consequence of it low permeability (K= 0.35x10⁻⁸ m2). The effect of convection transport increased with grain permeability (corn, K=1.61x10⁻⁸ m2; soybean, K=1.85x10⁻⁸m2) as the MC peak increased to 16.5 %w.b for corn and to 18 %w.b for soybean.
IV. CONCLUSIONS
In this work a bidimensional coupled momentum, heat and mass transfer model to predict the temperature distribution and moisture migration in a bulk of grain was described.
Validation was performed by comparing predicted and measured variables under laboratory conditions in corn and wheat. On average, standard errors were at most 1.7°C for temperature and 0.69% w.b for MC, while mean relative difference were 0.086 and 0.04, respectively. The model showed higher sensibility to variation in hygroscopic properties than to election of sorption isotherm. As result of hygroscopic properties and permeability of grain, for a given temperature gradient, MC migration was higher in soybean than in corn and wheat.
NOTATION
| ca | specific heat capacity of air, Jkg-1K-1 |
| cb | specific heat capacity of grain bulk, Jkg-1K-1 |
| Def | effective diffusivity of water vapour in intergranular air, m2s-1 |
| Dv | water vapour diffusivity in air, m2s-1 |
| g | gravitational acceleration, ms-2 |
| kb | thermal conductivity of grain bulk, Wm-1K-1 |
| K | grain permeability, m2 |
| Lg | latent heat of vaporization of moisture in the grain, Jkg-1 |
| n | normal direction |
| pv | partial pressure of water vapour, Pa |
| p | pressure, Pa |
| qH | heat release in respiration, 10.74 Jmg-1[CO2] |
| qW | water vapour release in respiration, 4.09x10⁻⁵ kg [H2O] mg-1 [CO2] |
| R | gas constant, 8.314 Jmol-1K-1 |
| Rv | water vapour gas constant, 461.52 Jkg-1K-1 |
| t | time, s |
| T | temperature, °C, K |
| v | superficial velocity, ms-1 |
| Wg | grain moisture content, d.b |
| YCO2 | respiration rate, mg[CO2]kg-1[dry matter] 24h |
| Greek Symbols | |
| β | thermal expansion coefficient of air, K-1 |
| Γ | boundary domain |
| ε | porosity |
| η | change in the partial pressure due to change in the moisture content at constant temperature, Pa |
| τ | tortuosity |
| ρa | air density, kgm-3 |
| ρbs | dry grain bulk density, kgm-3 |
| ω | change in the partial pressure due to change in the temperature at constant moisture content, PaK-1 |
| ψ | stream function, m3s-1 |
| Ω | domain |
| μ | viscosity of air, kgm-1s-1 |
| Subscripts | |
| 0 | initial or reference value |
ACKNOWLEDGEMENTS
The authors like to acknowledge the following institutions: ANPCYT/FONCYT (PICT 2008 0460), National University Rosario (PID ING295) and INTAPRECOP: Postharvest Efficiency for the financial support.
REFERENCES
1. Abalone, R.M., A. Gastón, L. Cardoso and J. Rodríguez, "Gas concentration in the interstitial atmosphere of a wheat silo-bag. Part I: Model development and validation," J. of Stored Prod. Research, 47, 268-275 (2011a).
2. Abalone, R.M., A. Gastón, L. Cardoso and J. Rodríguez, "Gas concentration in the interstitial atmosphere of a wheat silo-bag. Part II: Model sensitivity and effect of grain storage conditions," J. of Stored Prod. Research, 47, 276-283 (2011b).
3. Abbouda, S.K., D.S. Chung, P.A. Seib and A. Song, "Heat and mass transfer in stored milo. Part I: Heat transfer model," Trans. of ASAE, 35, 15691573 (1992a).
4. Abbouda, S.K., D.S. Chung, P.A. Seib and A. Song, "Heat and mass transfer in stored milo. Part II: Mass transfer model," Trans. of ASAE, 35, 15751580 (1992b).
5. Alagusundaram, K., D.S. Jayas, N.D.G. White and W.E. Muir, "Three dimensional finite element heat transfer model of temperature distribution in grain storage bins," Trans. of ASAE, 33(2), 577-584 (1990).
6. Al-Amri, A.M.S. and S.K. Abbouda, "Application of a mass transfer model for simulation and prediction of moisture distribution in stored corn grains," Sci. J. of King Faisal Univ. (Basic and Applied Sciences), 5, 197-212, (2004).
7. Andrade, E., S.M. Couto, D. Queiroz and L. Faroni, "Three dimensional simulation of the temperature variation in corn stored in metallic bin," ASAE Annual Meeting, Paper N02-3150 (2002).
8. Bern, C.J., J.L. Steele and R.V. Morey, "Shelled corn CO2 evolution and storage time for 0.5% dry matter loss," Applied Eng. in Agriculture, 16, 703-706 (2002).
9. Carrera-Rodríguez, M., G.M. Martínez-Gonzáles, J. Navarrete Bolaños, E. Botello Alvarez, R. Rico-MartÃnez, and H. Jiménez-Islas, "Transient numerical study of the effect of ambient temperature on 2D cereal grain storage in cylindrical silos," J. of Stored Prod. Research, 47, 106-122, (2011).
10. Chen, C.C. and R.V. Morey, "Comparison of four EMC/ERH equations," Trans. of ASAE, 32, 980990 (1989).
11. Cook, R., D. Malkus and M. Plesha, Concepts and applications of finite elements analysis, John Wiley & Sons (1989).
12. Dona, C.L. and W.E. Stewart Jr, "Numerical analysis of natural convection heat transfer in stored high moisture corn," J. Agric. Engng Res , 40, 275-284 (1988).
13. Gastón, A., R. Abalone, R.E. Bartosik and J.C. Rodríguez, "Mathematical modelling of heat and moisture transfer of wheat stored in plastic bags (silo-bags)," Biosystems Eng., 104, 72-85 (2009).
14. Iguaz, A., C. Arroqui, A. Esnoz and P. Vírseda, "Modelling and simulation of heat transfer in stored rough rice with aeration," Biosystem Eng., 89, 6977 (2004).
15. Jayas, D.S., K. Alagusundaram, G. Shunmugam, W.E. Muir and N.D.G. White, "Simulated temperatures of stored grain bulks," Canadian Agric. Eng, 36, 239-245 (1994).
16. Jia, C., D.W. Sun and C. Cao, "Computer simulation of temperature changes in wheat storage bin," J.of Stored Prod. Research, 37, 165-177 (2001).
17. Jian, S., D.S. Jayas, N.D.G. White and K. Alagusundaram, "A three-dimensional, asymmetric, and transient model to predict grain temperatures in grain storage bins," Trans. of ASAE, 48, 263-271 (2005).
18. Jiménez-Islas, H., J. Navarrete Bolaños and E. Betello Alvarez, "Numerical study of the natural convection of heat and 2D mass of grain stored in cylindrical silos," Agrociencia, 38, 325-342 (2004).
19. Khankari, K.K., Prediction of moisture migration in stored grain, Ph.D. Thesis, Univ. of Minnesota, St. Paul (1992).
20. Montross, D.M., D.E. Maier and K. Haghighi, "Development of a finite-element stored grain ecosystem model," Trans. of ASAE, 45, 1455-1464 (2002a).
21. Montross, D.M., D.E. Maier and K. Haghighi, "Validation of a finite-element stored grain ecosystem model," Trans. of ASAE, 45 1465-1474(2002b).
22. Navarro, S. and R. Noyes, The Mechanics and Physics of Modern Grain Aeration Management, CRC Press (2002).
23. Nguyen, T.V., "Natural convection effect in stored grains: a simulation study," Drying Technology, 5, 541-560 (1987).
24. Singh, A.K., E. Leonardi and G.R. Thorpe, "A solution procedure for the equations that govern threedimensional free convection in bulk stored grains," Trans. of ASAE, 36, 1159-1173 (1993).
25. Smith, E.A. and S. Sokhansanj, "Moisture transport caused by natural convection in grain stores," J. Agric. Engng. Res., 47, 23-34 (1990).
26. Thorpe, G.R, "Modelling Moisture Migration in Stored Grains," Proc. of an Int. Conf. Grain Drying in Asia, 99-122 (1995).
27. White, N.D.G., R.N. Sinha and W. E. Muir, "Intergranular carbon dioxide as an indicator of biological activity associated with the spoilage of stored wheat," Canadian Agric. Eng., 24, 35-42 (1982).
28. Zienkiewicz, O.C. and R.L. Taylor, The finite element method, McGraw Hill (1989).
