


Serviços Personalizados
Artigo
 pdf em Espanhol
 Artigo em XML
 Referências do artigo
 Permalink
Estudios Económicos
versão On-line ISSN 2525-1295
Estud. Econ. vol.30 no.61 Bahía Blanca jul. 2013
When more schooling is not worth the effort: another look at the dropout decisions of disadvantaged students
Rossana Patron*
* Departamento de Economía, Facultad de Ciencias Sociales- Universidad de la República, Uruguay E-mail: rossanapatron@fcs.edu.uy
enviado: noviembre 2012
aceptado: junio 2013
Resumen
La incorporación de la heterogeneidad del estudiante en el análisis, las diferencias en la calidad de la educación y en la probabilidad de repitencia, típicas en los países en desarrollo, marca la diferencia entre una inversión en educación atractiva y otra inconveniente. La metodología asocia la calidad educacional y las tasas de repitencia con los retornos a la educación. En particular, parece evidente que menos educación secundaria, en el caso de Uruguay, es una inversión inconveniente para los estudiantes con desventajas, aun no teniendo en cuenta la posibilidad de que dichos alumnos no puedan afrontar los costos de oportunidad, hecho que probablemente también explica la fuerte deserción de este tipo de estudiantes en muchos países en desarrollo.
Clasificación JEL: I21, J24
Palabras clave: Deserción Escolar; Calidad Escolar; Tasas de Repitencia.
Abstract
This paper shows that when student heterogeneity is introduced in the analysis, differences in the quality of education and in the probability of repetition, typical in developing countries, mark the contrast between an attractive and an inconvenient investment in education. The methodology associates educational quality and repetition rates with educational returns. In particular, it makes apparent that lower secondary education, in the case of Uruguay, is an inconvenient investment for disadvantaged students, even disregarding the possibility of such students not being able to afford the opportunity costs, this fact probably also explains the heavy dropout rates of this student type in many developing countries.
JEL classification: I21, J24
Keywords: School Dropouts; School Quality; Repetition Rates.
INTRODUCTION
Standard approaches to the estimations of education returns (reviewed, for instance, in Glewwe, 1996; Psacharopoulos, 1995; Psacharopoulos and Patrinos, 2004) rely heavily on the labour market return on the number of schooling years completed. However, it has widely been accepted that human capital cannot be measured adequately by the years of schooling, as the quality of education received directly affects the individual's endowment of human capital and, consequently, the individual's future benefits. Moreover, overlooking the occurrence of grade repetition leads to errors in estimates of the opportunity costs of schooling. Several improvements to the standard approach have been suggested, and although some authors consider the quality of education (e.g., Hanushek et al., 2006), the consideration of grade repetition is rarer in the education returns literature, and the inequality implications of these issues are usually overlooked.
The prevalence of repetition has, in general, received scarce attention, and the focus has been mainly on the negative effects on expectations (Jacob and Lefbren, 2004, 2007; Sautu, 1999; Rose et al., 1983, among others); thus, the economic implications of repetition have not been at the centre of the discussion. This note pursues a similar aim as that of Behrman and Deolalikar (1991) but allows for student heterogeneity; this note also follows a similar approach to that in a companion paper (Patron, 2008), although the emphasis here is on the methodology foundations to compute a priori returns across heterogeneous students, providing a decision tool for students. Moreover, contrary to the mainstream of the returns to schooling literature, here the economic returns are probabilistic (non-observable).
The rest of the paper is organized as follows. Section 2 presents the inequality aspects in education. Section 3 describes the methodological approach and estimates the expected internal rate of return for the Uruguayan case. Section 4 concludes. An Appendix provides additional computation details.
I. WHY IS THERE INEQUALITY IN EDUCATION?
Several data sources show the unequal distribution of educational attainment across income groups. For instance, Table 1 presents school coverage by income quintiles in several countries, showing that, although the completion of primary level is similar across income quintiles (almost universal), the completion rates at higher levels are not. The table shows that school coverage across income groups is significantly unequally distributed. In fact, the rates of attendance are lower the lower the income group is, and higher the higher income group is. Why could this be happening? Is one of the groups behaving rationally and the other not? Understanding such divergent schooling decisions is crucial to tackle adequately the unequal achievements in education.
Table 1 - School Enrolment Rates between Richest and Poorest Quintiles (%), by Age. Selected countries.
Moreover, differences in attendance rates are not the only problem affecting lower secondary school that raises equity concerns. The observed student performance, measured by repetition rates or by standardized tests, is also segmented by income groups. For instance, Table 2 presents the results of PISA tests for selected countries. The table shows that scores decrease with income bracket, in both developing and developed countries. For instance, in Brazil, the mean score of the 90th percentile is about 80% higher than the corresponding score for the 10th percentile; for the OECD countries, the gap is not that high but is still impressive, as the mean for the 90th percentile is about 65% higher than that of the 10th.
Table 2 - PISA results by income brackets for selected countries
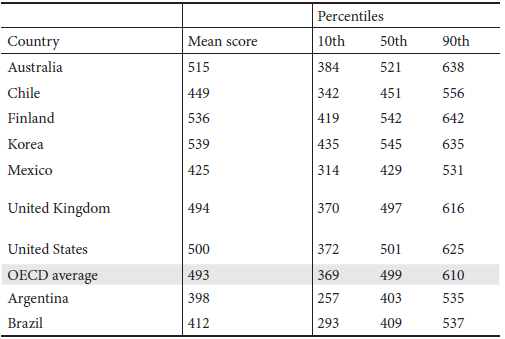
Source: Extract from OECD (2010), p. 152.
In summary, the above description shows that educational attainment across income groups is unequally distributed. The impact of these facts on staying-at-schooling decisions are discussed in the rest of the paper.
II. METHODOLOGY
As Eckstein and Wolpin (1999) demonstrate, expected economic return affects the number of high school graduates. For the individual, the economic gains of further education are given by the difference in lifetime income between the benefits of additional schooling and its costs; however, across heterogeneous agents the fruits from education are unevenly reaped.
In the labour market, earnings depend on the qualifications acquired during the schooling years, as human capital determines the productivity of individuals. The acquired knowledge of students defines 'school quality' (following Hanushek, 1979), modelled as  where
where  is the resource intensity per student, and the sub-indexes j and k represent schooling level and student type, respectively. Repetition rates are modelled as a consequence of low quality,
  , where
  . Successful students accumulate knowledge, whereas repeaters do not. The accumulation of
  during the schooling years is
  which measures the stock of knowledge up to level m.
Individual decisions on whether to continue studying or to go to the labour market is based on the comparison between the respective lifetimes incomes of the two alternatives. The present value of income for those who decide to work immediately with the qualification acquired up to level j is given by 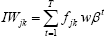 where T is the time horizon, w is the wage rate per efficiency unit (assumed constant),
  is the discount factor, and d is the discount rate. Further studies allow earnings given by
  , the present value of expected lifetime income for that schooling level. All alternative paths through schooling years, considering the risk of occurrence of repetition, need to be considered for computation purposes (see below).
The benefits from further schooling come from the difference  .
.
The rate that makes the benefits 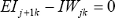 is the expected internal rate of return (IRR) of schooling. A basic approach to compute it for heterogeneous students is presented below in four simple steps, which constitute the main contribution of this note.
II.1 Mapping paths for students in lower secondary
Student transit across the system (primary, secondary, and tertiary) is not straightforward, considering the frequent occurrence of repetition in developing countries. Table 3 shows the involved risks in this path that must be considered, for instance, the options after primary, assuming that individuals will exit after two consecutive repetitions.
Table 3 - Mapping paths in lower secondary
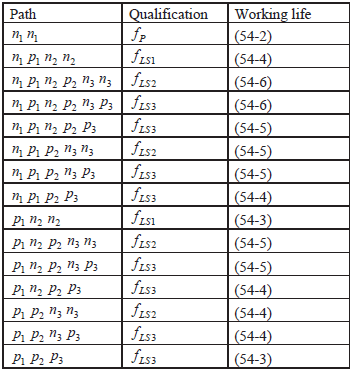
Source: Own elaboration. Notation: p, pass; n, no pass; grades i = 1, 2, 3,  qualification acquired up to grade i of Lower Secondary (LS);
  , qualification prior to entry level.
The first column of the table lists all possible paths, pass (p) or no pass (n) on each grade in lower secondary; the second column lists the qualifications acquired during the corresponding path; and the third column reflects the actual working life span for each option, considering the calendar years effectively needed to acquire the qualification (with 65 years old as the retirement age, the working life span for those not enrolling in lower secondary is 65-11=54).
II.2 Estimation of non-observable variables
For the average student/worker, the non-observable variables qj and fj for the average qualified student can be proxied by information on the workers' remuneration by schooling (rj). For this estimate the following expression is useful, on the assumption that workers receive as remuneration the value of their productivity gained through schooling (measured in efficiency units):
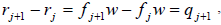 |
where qj is the students' acquired knowledge at level j, fj is knowledge accumulation (summing qj), w is the wage rate per efficiency unit (assumed constant), and rj is remuneration received by workers.
Using data from remunerations for the Uruguayan case, the non-observable variables are computed, normalizing the remuneration (r) for workers without qualification to one (and setting w = 1 for ease of computation). Table 4 shows the resulting values for the average/student worker. The relevant schooling levels considered are primary, lower secondary, upper secondary and tertiary (j = P, LS, US, TE).
Table 4 - Computation of non-observable variables. Average student-worker
Source: Own estimates. Remunerations are monthly wages in Uruguayan pesos, data for 2005, from the National Census Bureau (INE, 2005)
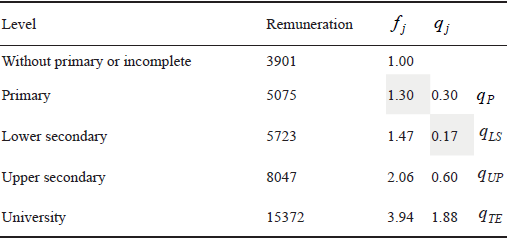
A breakdown of accumulation by the average student at lower secondary year by year in this level, assuming equal distribution each year, gives the corresponding values shown in Table 5.
Table 5 - Computation of non-observable variables for lower secondary. Average student-worker
Source: Own estimates
II.3 Heterogeneity in quality
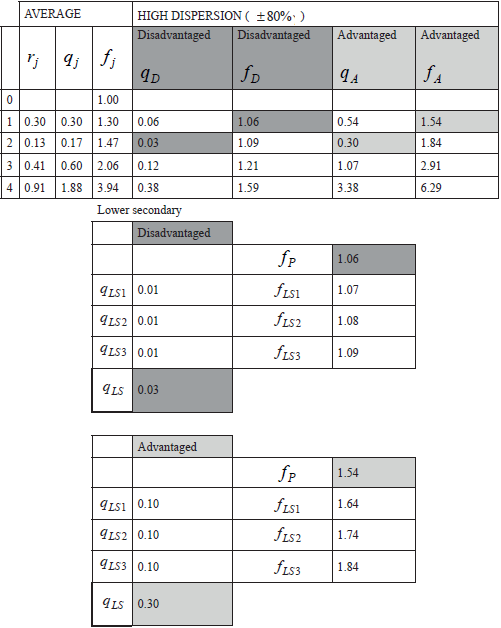
The available data only allow finding proxies for the non-observable variables qj and fj for the average student/worker. The consideration of heterogeneous agents will require the introduction of a plausible assumptions of dispersion around the average. Alternative scenarios of dispersion for qj and probability of passing grades (pi) by student type (advantaged and disadvantaged) are: high dispersion ( ± 80% ), medium dispersion ( ± 40% ), and low dispersion, ( ± 10% ) (full details in the Appendix).
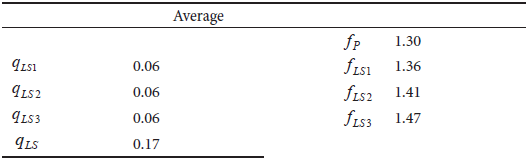
II.4 Expected Internal Rate of Return
The rate that makes is the expected IRR, where IWjk is the present value of income for those who decide to work immediately, and is the present value of expected lifetime income for that schooling level. After primary, the decisions of students will consider all alternative paths through schooling years (see Table 3), resulting in the following expressions:
 |
where  ,
,
Considering  for each group, the results for expected IRR are obtained.
The expected IRR of lower secondary studies for different groups of students is computed for the case of Uruguay, as an example that reveals the potential of the methodology. The values for repetition rates n1 = 0.27, n2 = 0.23, and n3 = 0.24 are obtained from ANEP (2005); estimations for fLSi are shown in the Appendix. Table 6 presents the expected IRR for lower secondary school in a time horizon covering the whole working life span for advantaged and disadvantaged students.
Table 6 - Expected IRR for heterogeneous students
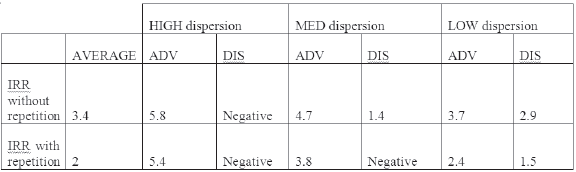
Source: Own estimates with methodology in section 3.
As can be seen in Table 6, the expected IRR is low for the average student, computed with and without repetition. When we consider heterogeneous students, marked differences across student groups emerge. Whereas for advantaged students, the expected IRR is at reasonable levels (2.4%-5.8%) in all cases, for disadvantaged students, pursuing lower secondary studies could have a negative return when we take into account the occurrence of repetition. Even in cases where the return for the disadvantaged is positive, it is very low (1.4%-2.9%). Thus, the expected IRR values computed for the Uruguayan case allow the conclusion that lower secondary education is an inconvenient investment for disadvantaged students, as they would very likely obtain a negative return; hence, they behave rationally, dropping out of school early.
CONCLUSIONS
In most countries, schooling decisions seem to have a clear association with level of income. This is even more troublesome in developing countries, where high exit rates at compulsory stages are common. Why could this be happening? When students heterogeneity is considered, it can be seen that the benefits and costs of education differ across income groups. Indeed, differences in the quality of education and in the probability of repetition make the difference between an attractive and an inconvenient investment in secondary education between advantaged and disadvantaged students. Thus, according to this approach, both groups taking opposite schooling decisions behave equally rationally. Not including differences in life expectancy across income groups is a limitation of the analysis, although its consideration would reinforce the results.
The values of the expected IRR computed for the Uruguayan case show that, paradoxically, lower secondary education is an inconvenient investment for disadvantaged students-even disregarding the possibility of their not being able to afford the opportunity costs-which probably explains the heavy dropout rates of this student type in developing countries. Previous studies on returns to schooling, even when methodologies are not comparable, also provide low estimates for rates of return for secondary studies, for instance Duryea et al. (2003) and Duryea and Pages (2002). These results cast some serious doubts on the fairness of compulsory schooling laws that are not accompanied by complementary policies that ensure equal learning outcomes across socioeconomic groups.
APPENDIX
This Appendix shows computations based on Table 4 in the text. Table 4 shows average values for which available data allow quite straightforward estimate of non-observable variables. Based on averaged values, plausible scenarios of dispersion around the average will be considered as follows: low dispersion ( ± 10% ), medium dispersion ( ± 40% ), high dispersion ( ± 80% ). Values obtained for fLSi by student type are used for computation of the expected IRR in Table 6 in the text.
Table A.1 - Computation of non-observed variables: Average and low dispersion
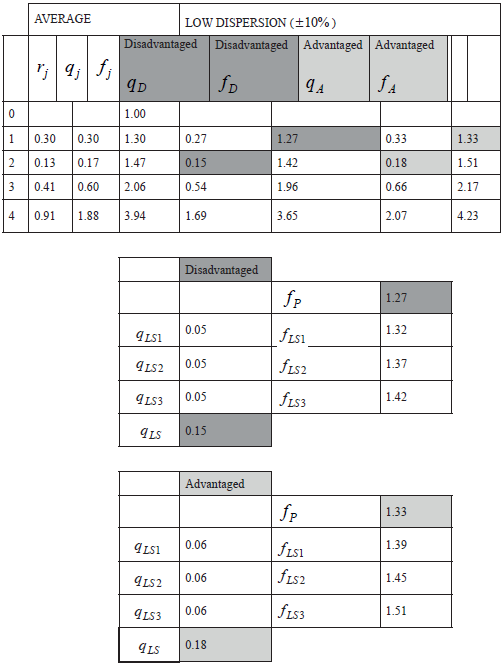
Table A.2 - Computation of non-observed variables: Average and medium dispersion
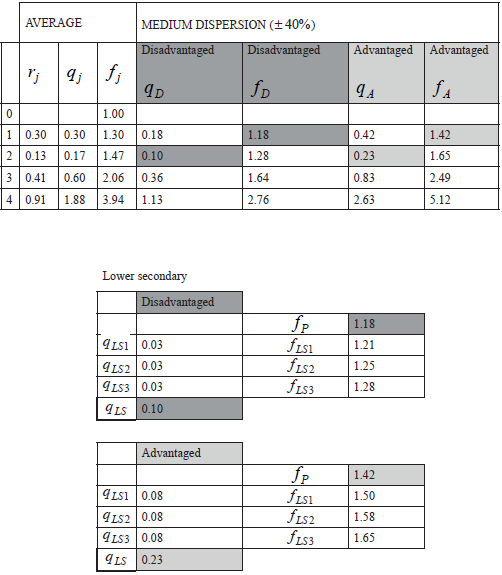
Table A.3 - Computation of non-observed variables: Average and high dispersion
REFERENCES
1. ANEP, (2005), Panorama de la educación en el Uruguay. Una década de transformaciones 1992-2004. Gerencia de Investigación y Evaluación. Available online http://www.infamilia.gub.uy/page.aspx?1,7,194,O,S,0,
2. Behrman, J. and Deolalikar, A., (1991), "School repetition, dropouts, and the rates of return to schooling: the case of Indonesia", Oxford Bulletin of Economics and Statistics, Vol. 53, (4), pp. 467-480.
3. Duryea, S. and Pages, C., (2002), Human capital policies: What they can and cannot do for productivity and poverty reduction in Latin America, Inter-American Development Bank, Working Paper No. 468.
4. Duryea, S., Jaramillo, O. and Pages, C., (2003), Latin American labor markets in the 1990s: Deciphering the decade, Inter-American Development Bank, Working Paper No. 486.
5. Eckstein, Z. and Wolpin, K., (1999), "Why youth drop out of high school: the impact of preferences, opportunities and abilities", Econometrica, Vol. 67, (6), pp. 1295-1335.
6. Glewwe, P., (1996), "The relevance of standard estimates of rates of return to schooling for education polity: A critical assessment", Journal of Development Economics, Vol. 51, pp. 267-290.
7. Hanushek, E., Lavy, V., and Hitomi, K., (2006), Do students care about school quality? Determinants of dropout behavior in developing countries, NBER Working Paper No. 12737.
8. Hanushek, E., (1979), "Conceptual and empirical issues in the estimation of educational production functions", Journal of Human Resources, Vol. 14, (3), pp. 351-388.
9. Jacob, B. and Lefgren, L., (2007), The effect of grade retention on high school completion, NBER Working Paper No. 13514.
10. Jacob, B. (2004), "Remedial education and student achievement: a regression discontinuity analysis", The Review of Economics and Statistics, Vol. 86, pp. 226-244.
11. OECD, (2010), PISA 2009 Results. Volume II: Overcoming social background: Equity in learning opportunities and outcomes. Available online http://dx.doi.org/10.1787/9789264091504-en
12. Patron, R. (2008), "Early school dropouts in developing countries: An integer approach to guide intervention. The case of Uruguay", Journal of Economics, Banking and Finance, Vol. 2, (2), pp. 1-11.
13. PREAL, (2006), "Quantity without quality. A report card on education in America Latina" PREAL http://openlibrary.org/books/OL22570031M/Quantity_without_quality.
14. Psacharopoulos, G. and Patrinos, A., (2004), "Returns to Investment in Education: A Further Update", Education Economics, Vol. 12, (2), pp. 111-134.
15. Psacharopoulos, G., (1995), The Profitability of Investment in Education: Concepts and Methods, HCO Working Papers, Washington, DC, World Bank.
16. Rose, J., Medway, F., Cantrell, V. and Marus, S. (1983), "A fresh look at the retention-promotion controversy", Journal of School Psychology, Vol. 21, pp. 201-211.
17. Sautu, R., (1999), Poverty, Psychology, and Dropouts. In Schooling for Success. Preventing Repetition and Dropout in Latin American Primary School, Eds. L. Randall & J. Anderson, M. E. Sharpe, New York.
