


Serviços Personalizados
Artigo
 pdf em Inglês
 Artigo em XML
 Referências do artigo
 Permalink
Estudios Económicos
versão On-line ISSN 2525-1295
Estud. Econ. vol.35 no.70 Bahía Blanca jan. 2018
The effects of referees on the final score in football° ˜
El efecto de los árbitros sobre el resultado en el fútbol
Matías Fontenla* - Germán M. Izón**
* Department of Economics, University of New Mexico. E-mail: fontenla@unm.edu
** Department of Economics, Eastern Washington University. E-mail: gmuchnikizon@ewu.edu
enviado: 31 julio 2017
aceptado: 3 octubre 2017
Abstract
This paper examines whether there exists favouritism by individual referees in favour of the home team in Argentina's first division football (soccer) league. We study 936 matches between 2008 and 2010, and run both ordinary least squares (OLS) and two-stage least squares (2-SLS) specifications. Using goal differential between the home and away teams as the dependent variable, we find that individual referees have a statistically significant effect on the score of the game, even after controlling for referee actions such as yellow and red cards, penalties awarded, and other factors such as team quality, crowd size, and crowd composition. Crowd size and composition do not seem to affect the outcome of the game.
JEL Code: D81, L83.
Keywords: Referee Bias; Favouritism; Football; Soccer.
Resumen
Este artículo examina si existe favoritismo por parte de árbitros en favor del equipo local en la liga de fútbol de primera división de la Argentina. Estudiamos 936 juegos entre 2008 y 2010, y ejecutamos las especificaciones de mínimos cuadrados ordinarios (OLS) y de mínimos cuadrados de dos etapas (2-SLS). Utilizando el diferencial de goles entre el equipo local y el equipo visitante como variable dependiente, encontramos que los árbitros individuales tienen un efecto estadísticamente significativo en el resultado del juego, incluso después de controlar por las acciones de los árbitros como tarjetas amarillas y rojas, sanciones y otros factores como calidad del equipo, tamaño de la asistencia, y composición de la asistencia. El tamaño y la composición de la asistencia no parecen afectar el resultado del juego.
Código JEL: D81, L83.
Palabras clave: Sesgo de Árbitro; Favoritismo; Fútbol.
INTRODUCTION
In football, also known as soccer, referees may have significant power and influence over the final outcome of a game through goals validated, penalties, red and yellow cards, off-side and foul calls, among other actions. Referee's actions on the field, if biased, may be contrary to the best interest of the sport. As this bias increases, the sport may lose popularity as fans question the fairness of the competition, with the direct consequence of revenue loss for the league.
Existing economic research has shown to uncover systematic bias in sports. Dohmen and Sauermann (2016) provide a survey of the literature. For example, Duggan and Levitt (2002) find evidence consistent with match rigging in Sumo wrestling. Garicano et al. (2005) in the Spanish football league, Sutter and Kocher (2004) in the German league, and Lucey and Power (2009) in the US Major League Soccer (MLS) and the Italian league, all empirically test for the presence of home team bias by considering the amount of injury time a referee adds after the 90 minutes of regulation. They all find that referees tend to add more injury time when the home team is losing by one goal, than when it is ahead by one goal1.
Nevill et al. (2001) apply a control-group strategy, by asking forty English Premier League referees to classify different types of tackles shown on a video as either legal or illegal. Half of the referees were shown the tackles with background crowd noise, and the other half were shown the same tackles with no audio. Those referees watching the video with crowd noise were 15.5% less likely to classify a tackle committed by the home team as illegal, compared to those referees watching in silence2. Along the same lines, Pettersson-Lidbom and Priks (2010) were able to compare referees' decisions in games with and without spectators, following a regulation by the Italian government prohibiting some football clubs to play games with a crowd present. Their findings show that referees tend to penalize the away players more severely than the home team when the games were played in front of spectators, compared to when a game was played with no spectators. On the other hand, Lucey and Power (2009) find no correlation between referees' actions and the social environment when they analysed the MLS and Italian leagues.
The presence of referee bias, however, does not necessarily imply that a game outcome is affected by such bias. In fact, while referees tend to add or reduce extra time to benefit the home team, these studies find the effect on the final score not to be significant. Also, these studies have found mixed results on whether the social environment, i.e. the home crowd, has any effect on referees' extra time choice, and thus on favouritism. Our paper contributes to the literature in sports economics by looking at referee's influence on the final outcome of a game.
This paper investigates whether individual referees have a systematic effect on the outcome of a game, using Argentine first division data for 2008-2010. After accounting for team quality, attendance, yellow and red cards, penalties awarded, distance between stadiums, and other control variables, our results indicate that referee bias is a significant and sizeable factor affecting the game's score in favour of the home team. As referees are supposed to be impartial, they should have no effect on the outcome of the game. We find this not to be true. In our most extreme case, a referee significantly favoured home teams by 0.52 - 0.7 goals per game, on average.
Boyko et al. (2007) study the effect of individual referees on scores for the English Premier league. They find both statistically differences among some referees on their influence on scores, and find that the larger the attendance, the greater the home-side advantage. However, Johnston (2008) replicates that study updating the same English Premier data, and finds no evidence for any of Boyko et al. claims. Our paper follows a similar approach to Boyko et al. (2007) and Johnston (2008) in that we study effects on the game's score. We differ from them in that we test for individual referee effects on the outcome of the game, and add spatial variables as controls. Further, this paper accounts for potential endogeneity problems by using an instrumental variables approach. While we find that referees influence the score, we find no evidence of crowd size or crowd composition on home-side advantage.
In our study, individual referees have a statistically significant effect on the outcome of the game, when they clearly should not. Thus, the policy implications of this paper should be straightforward. Our results call for actions that minimize the effect of referees on the score, such as better training, technological aides, or employing multiple referees on the field. Such measures have been successfully adopted in other popular sports. For example, in American Football in the US (NFL), there are 7 referees on the field, in addition to referees in a booth instantly reviewing plays captured by TV cameras. Tennis has one umpire and multiple linesmen, in addition to the aid from the Hawk-Eye technology, which triangulates high speed cameras to replicate the ball's exact path. Cricket also uses Hawk-Eye technology.
I. ENVIRONMENT
For each match, a principal, the Argentine Football Association (AFA), randomly assigns an agent, the referee, plus three side-line assistants. The principal's objective function should be optimized when the agent is impartial, and behaves in an unbiased way. When an agent acts in ways that are contrary to the principal's best interest, a principal-agent, or moral hazard problem emerges (Hart and Holmström, 1987). As referee bias becomes pervasive, the sport may lose followers as they question the fairness of the competition. Loss of popularity then translates into lower television ratings with their corresponding lower advertising revenues. Loss of the sport's popularity also reduces revenues via lower stadium attendance, ticket sales, sponsorships, and apparel sales.
Referees have several ways to impart justice and thus achieve a fair outcome: goals validated, penalties awarded, red and yellow cards, off-sides, foul calls, and injury time. An action by a referee can change the course of a game, and its outcome. Goals and penalties not awarded, red cards given, and off-sides not called that result in a goal are unequivocal examples of the effect a referee may have on the game's outcome. However, subtler actions by the referee may also affect the score. For instance, an unfair yellow card shown to a defender early in a game conditions that player for the remainder of the match, forces him to play with extra caution, which may increase the probability of a score from the opposing team. Because of all this, a single person on the field, the referee, has significant power and influence over the final score of a game.
Several reasons can be offered as to why a referee may behave in a biased way, besides potential pecuniary incentives. First, referees may have "scenic fear." That is, referees can be intimidated by the home stadium, its supporters, the home-crowd noise, and thus show bias toward the home team, as in Nevill et al. (2001), and Pettersson-Lidbom and Priks (2010).
Other influences on referees may come in the form of pressure from league officials, whose revenues may depend on popular teams doing well. In 2009, an AFA official was forced to retire after telephone recordings showed him pressuring a referee to favour a specific team. Club authorities, coaches, and players may also influence a referee's actions by publicly complaining about the designation of a referee prior to the game.
The mechanism through which referees are designated to football games has also been controversial. While in Argentina the selection of referees is officially a random process, there have been accusations that they are designated by hand, and in many cases to please certain teams.
II. DATA
To determine the factors that influence home advantage in a football match, data was gathered for games played in Argentina between 2008 and 2010, from 3 sports website3. They provide information on all the matches played in the first division, which for our period of study consisted of 20 teams. The 2008-2010 competitions each comprised one round, where teams play each other once, for a total of 19 total games per team. A total of 936 games were played between 2008 and 2010, in which 26 different referees officiated.
For each match the variables gathered are: date, referee, stadium attendance, distance between stadiums, and for both the home and away teams: team name, number of goals scored, yellow and red cards received, and penalties awarded4. Pre-game season standings were also recorded. In addition, we record whether a team is fighting to prevent relegation, and whether it is playing in an international competition. Finally, we create a dummy variable for the five most popular teams, commonly known as the "big-five", for their large following, and the special concessions they get from AFA on voting rights and revenue sharing. The big-five teams are Boca Juniors, River Plate, Independiente, San Lorenzo and Racing. Recent polls show that their followers comprise 86.6% of all fans in the nation, with Boca Juniors taking a 40.4% share, while River Plate takes 32.6% (Equis 2006).
Table 1 shows home advantage, as measured by score difference, for each referee in our data5. Score difference, which is the dependent variable in our estimations, is defined as goals scored by the home team, minus goals scored by the away team, for each individual game. There is a marked variation in score difference by referee: it is almost zero for Ref1, while Ref22 averages almost one goal in favour of the home team. Table 1 also shows the average yellow card difference, as well as the average difference for red cards and penalties awarded, by referee. The correlation coefficient between score and yellow cards is -0.26, for score and red cards, it is -0.25, while the correlation between score and penalties awarded by referee is -0.32.
Table 1: Descriptive Statistics by Referee
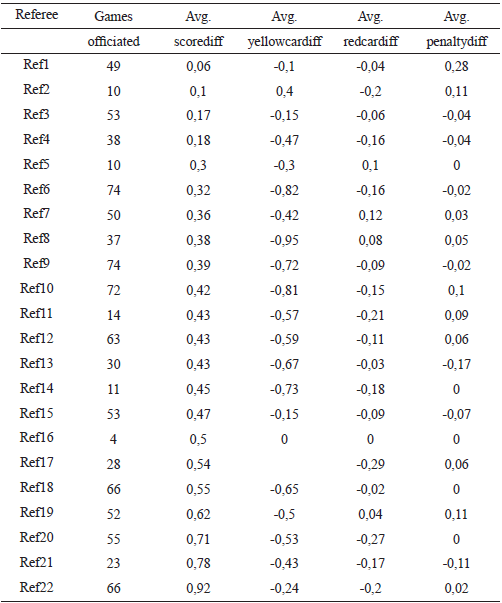
"Ref j " refers to one of the twenty-two referees who officiated games during the 2008-2010 period;
"avg. scorediff": Average difference between home and away goals, per game;
"avg. yellowcardiff": Average difference between home team and away team yellow cards, per game;
"avg. redcardiff": Average difference between home team and away team red cards, per game;
"avg. penaltydiff": Average difference between home team and away team penalties, per game;
Fuente: Elaboración propia
Descriptive statistics on the data gathered for this study are reported in Table 2. On average, the home team wins by almost half a goal, as measured by our dependent variable scorediff. Variations in team quality, or ability, are accounted for via two different variables: avgdiff and rankdiff. The variable avgdiff is defined as the average difference between the number of goals scored and received by the home team minus the average number of goals scored and received by the visiting team, prior to the match between the two teams. This variable can be interpreted as an average of the lags of the dependent variable. The position in the table of the home team minus the position in the table of away team defines rankdiff. Thus, a negative number would mean that home team is ranked higher than the away team.
Table 2: Descriptive Statistics
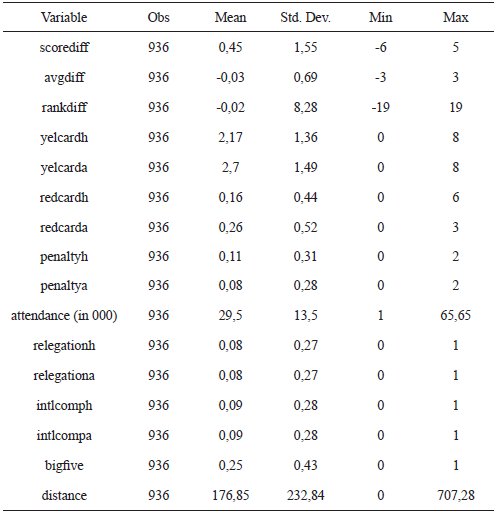
"scorediff": final score difference between home and away team i;
"avgdiff": total average score difference between home team and away team prior to their game.
"rankdiff": standing of home team minus standing of away team;
"yelcardh": number of yellow cards given to home team; "yelcarda": away team;
"redcardh": number of red cards given to home team; "redcarda": away team;
"penaltyh": number of penalties given to home team; "penaltya": away team;
"relegationh": 1 if home team competing for not going to second division, 0 elsewhere;
"intlcomph": 1 if home team participating in international competition;
"bigfive" 1 if one of the top five most important teams in the Argentine league, 0 elsewhere;
"distance": distance between the home team stadium and the away team stadium, in miles (GIS) III.
Fuente: Elaboración propia
Table 2 also shows yellow cards, red cards and penalties awarded to the home and away teams. On average, the away team receives roughly half a yellow card more than the home team, 0.1 more expulsions, and gets 0.03 fewer penalties awarded. Mean attendance is 29,500 spectators, with a large variance.
III. EMPIRICAL FRAMEWORK
Two econometric approaches are implemented to test whether referee bias is present in football matches in Argentina: ordinary least squares (OLS) and two-stage least squares (2-SLS). Both techniques are used to estimate the following equation:
 | (1) |
where subscript i represents a given match. The X vector of variables represents team characteristics. It includes relative team qualities as measured by rankdiff. We include attendance in order to measure whether the crowd size influences the referee. Distance between stadiums should serve as a proxy for crowd composition. That is, the closer two stadiums are, the likelier more supporters of the away team will travel to see their squad. Whether a team is fighting against relegation may also influence the game, since having a lot at stake may provide additional motivation to the players. Teams that play mid-week in international competitions may either have tired players, or preserve their best players for such competitions. Thus, we add whether the team is playing internationally as a control variable. Finally, we add a dummy that indicates whether the away team is a big-five team.
The vector Y includes referee actions, which are yellow and red cards, and penalties awarded. These actions by the referee may represent fair events in the game. However, they can also embody unfair actions by the referee, which may directly affect the outcome of the game. Thus, systematic referee actions in the form of number of cards and penalties in favour of the home team may represent bias.
There are other, subtler, ways that a referee can influence the score, beyond the simple number of cards and penalties called. For example, a red card to a key player at the beginning of the game may have a large effect on the outcome of the game, while a red card in the last minutes of the game may not be of much consequence. Calling a foul right outside the box, off-sides not called, and goals validated or not may all be outcome changing decisions. In order to capture these potential effects, we include referee fixed effects, Ref, into our specifications, where referee j is assigned to officiate game i. In theory, it should not matter which referee is officiating any given game, so that the coefficients for individual referees should all be close to zero and statistically insignificant.
The OLS model has been the preferred econometric approach for most of the papers examining the relationship between home advantage and referee bias. However, in our study the presence of avgdiff as an independent variable, which behaves as a lagged variable, suggests that the estimated OLS coefficients in equation (1) may be biased and asymptotically not consistent, due to correlation or endogeneity between avgdiff and the error term.
To address this potential correlation between an explanatory variable and the error term, we use the two-stage least squares (2-SLS) approach. This method consists on estimating the coefficients in equation (1) in two stages. In the first stage, avgdiff, the endogenous variable, is regressed using the following instruments:
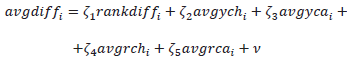 | (2) |
where avgych and avgyca are the average number of yellow cards received by the home and away teams, respectively, prior to the match between them. Similarly, avgrch and avgrca are the prior average number of red cards received by the home and away teams, respectively. Again, avgdiff is defined as the average difference between the number of goals scored and received by the home team minus the average number of goals scored and received by the visiting team, prior to the match between the two teams.
From the first stage estimation, the following equation is obtained:  . In the second stage,
  is substituted for avgdiff in equation (1), given:
 | (3) |
For our instruments to be valid, they need to be correlated with the endogenous variable avgdiff in the first stage given by equation (2), and they cannot be correlated with the error term in our explanatory equation (3). We perform Stock and Yogo's (2005) test for weak instruments, and reject the null hypothesis of weak instruments at the 5% relative bias rate. To test whether our instruments are uncorrelated with the error term, or that our first stage is misspecified, we perform Sargan's (1958) and Basmann's (1960) tests. We do not reject the null hypothesis of valid instruments at the 5% significance level.
Intuitively, average card differences from previous matches should be correlated with average score differences from previous matches, as both are moving averages across specific teams. In contrast, average card differences from previous matches should be significantly less correlated to the current score of a game. The above tests confirm this intuition.
IV. RESULTS
Table 3 reports the results for the OLS models. Model (1) excludes the measurable referee actions Y, which are yellow and red cards, and penalties. Model (2) includes the vector Y. Both models support our main result that referee bias has an important effect on home advantage. In both models, 12 out of 21 show a positive, statistically significant effect on the outcome of the game.
Table 3: Ordinary Least Squares
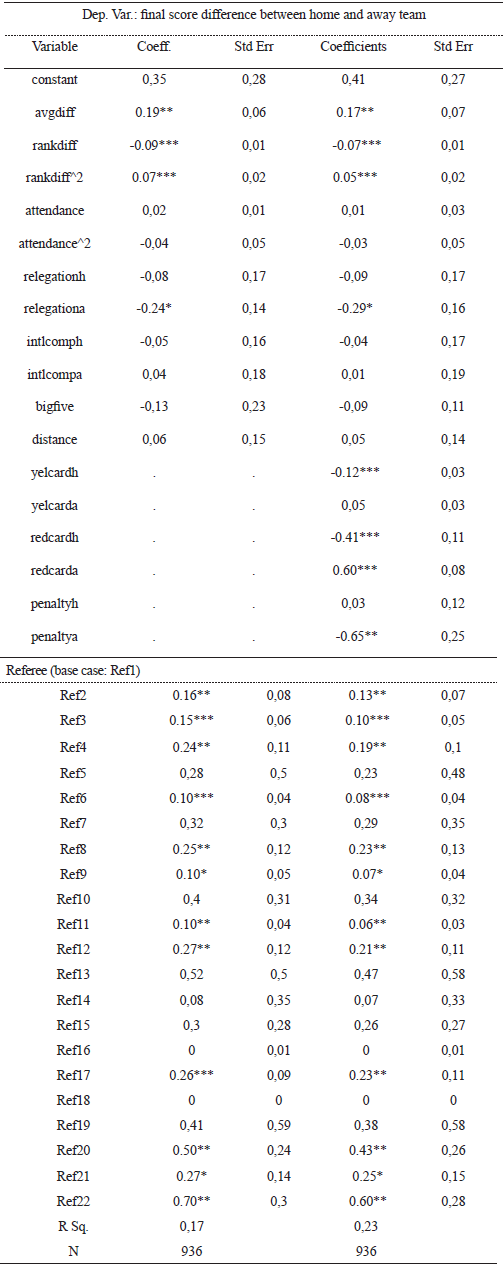
*, **, and *** denote statistical significance at the 10%, 5%, and 1%, respectively.
Fuente: Elaboración propia
Also, we conduct an F-test to verify whether all the coefficients for the referees are together statistically different from zero. We reject the null hypothesis that all of them are zero, thus further supporting our finding that referee home bias is present in the Argentine football league.
When we control for cards and penalties in model (2), all results carry through. The coefficients for referees are slightly lower, but remain positive and statistically significant. That is, referee bias occurs in a more sophisticated manner than just through the number of cards and penalties.
For example, when Ref22, who officiated 66 games in our sample, is the referee, the home team is helped by 0.7 goals in model (1). When we directly account for cards and penalties, Ref22's presence on the field accounts for 0.6 additional goals, and remains significant at the 95% confidence level.
It is worth noting that all the coefficients for the other variables have the intuitive correct sign. Differences in ranking have a positive explanatory power over the score, and the effect increases at a decreasing rate. Also, prior goal difference has explanatory power on the game's outcome. As expected, cards given and penalties awarded are strong determinants of the score. The attendance effect on the score increases at a decreasing rate, but is not statistically significant. Distance between stadiums has the expected sign, but is also not statistically significant. That is, we find no effect of crowd size, nor crowd composition on home-side advantage6.
Table 4 shows the results for the 2-SLS models. We perform a Hausman test to assess whether the coefficients for the OLS and 2-SLS models are statistically different. We find that it is significant at the 99 percent confidence level. This supports the use of the 2-SLS model, and sustains the hypothesis that the inclusion of avgdiff as an explanatory variable may result in endogeneity problems with the error term.
Table 4: 2-SLS
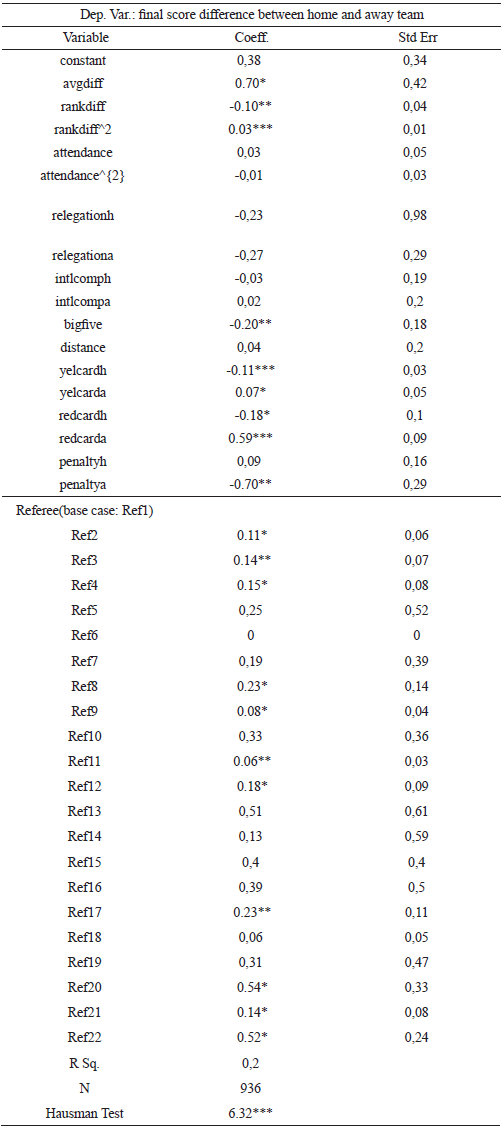
*, **, and *** denote statistical significance at the 10%, 5%, and 1%, respectively.
Fuente: Elaboración propia
However, our 2-SLS results remain notably similar to the OLS specifications. Perhaps worth noting is the fact that the coefficient for big-five teams is larger relative to the OLS models, and becomes significant at the 5 percent level.
As robustness tests, and to further inquire whether specific teams are driving our results, we partition our data in various ways, add dummy variables for individual teams, and interact individual teams with individual referees. We find no evidence of specific teams driving our main results, nor any particular interaction between specific teams and referees.
Neither the two "biggest" teams, Boca Juniors and River Plate, nor the larger group of big-five teams, show significance when we add them as individual dummies, nor when we interact them with individual referees. When we partition our sample as to have the big-five playing at home against "small" away teams, our results remain mostly unchanged. Perhaps worth noting, though, is that in this latter case penalties awarded to the small away teams loses significance. We suspect that this is the case not because the variable per se stops affecting the score, but because penalties may lose variation. In other words, there are few matches with penalties awarded to the small away team, when it is playing against a home big-five team.
When we partition the sample to include only small teams playing against small teams, our results also remain mostly unchanged. Thus, taken together, our results suggest that referee bias occurs independently of relative team importance.
As an exercise to aid to the interpretation of these coefficients, Figure 1 shows the estimated home advantage for each referee, based on the 2-SLS model. They are estimated through the following equation:
 | (4) |
Figure 1: Estimated Avg. Score Difference by Referee
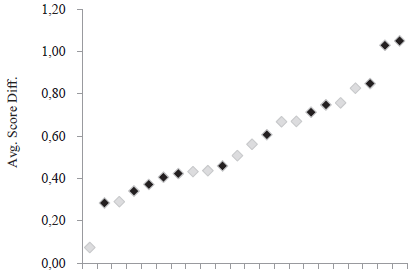
Note: Referees are plotted on the x-axis. Darker color denotes statistical significance.
Fuente: Elaboración propia
where the values for the explanatory variables are the mean values that correspond to each referee and the value for refj is set to one. The estimated average score difference is 0.45 with the highest value of 0.92 for Ref22.
CONCLUSION
This paper represents the first attempt to econometrically estimate the effect of referees' decisions on the final score of a football match in Argentina. In light of the ongoing international debate about the performance of referees officiating football matches, this paper provides evidence that referees do influence the final score of a football game.
Recent research has shown evidence of home bias in referees' decisions via added injury time. However, this bias has not shown a significant effect on the game's score. After controlling for team ability, attendance, cards, penalties and other variables, this paper finds that individual referees affect the outcome of a game in the Argentine football league, when they clearly should not. These findings are based on both OLS and 2-SLS models, in which we use instruments to correct for potential endogeneity problems.
Other popular sports have successfully implemented actions to minimize referee errors and help them in making the correct calls. In particular, additional referees on the field, and instant video replays have been effectively implemented across other popular sports, such as Tennis, Cricket, and American Football. Our results suggest that such aides should be implemented in football.
Notas
° Fontenla, M., & Izón, G. M. (2018). The Effects of Referees on the Final Score in Football. Estudios económicos, 35 (70), 79-97.
˜ We would like to thank seminar participants at the University of New Mexico, the editor, Germán González, and two anonymous referees for helpful comments that greatly improved the manuscript.
1 In football, the referee adds, at his own discretion, "injury time" at the end of the regulation 90 minutes of play, to compensate for game delays such as injuries and substitutions.
2 It is worth noting that the classifications obtained from the referees watching the tackles with crowd noise were in line with the decision made by the original official of the game.
3 espndeportes.com, espanol.sports.yahoo.com, and www.ole.com.ar
4 Distance between stadiums was calculated using ArcMap 10.
5 We exclude 4 referees that officiated only one game during our data period. Including them does not affect our results.
6 We also interact each referee dummy with crowd size and distance, for robustness purposes. We find those effects to be not significant.
REFERENCES
1. Basmann, R. L. (1960). On finite sample distributions of generalized classical linear identifiability test statistics. Journal of the American Statistical Association, 55 (292), 650-659.
2. Becker, G. S., & Stigler, G. J. (1974). Law enforcement, malfeasance, and compensation of enforcers. The Journal of Legal Studies, 3 (1), 1-18.
3. Boyko, R. H., Boyko, A. R., & Boyko, M. G. (2007). Referee bias contributes to home advantage in English Premiership Football. Journal of Sports Sciences, 25 (11), 1185-1194.
4. Dohmen, T., & Sauermann, J. (2016). Referee bias. Journal of Economic Surveys, 30 (4), 679-695.
5. Duggan, M., & Levitt, S. D. (2002). Winning isn't everything: Corruption in sumo wrestling. American Economic Review, 92 (5), 1594-1605.
6 .Equis (2006). Estudio sobre adhesiones a equipos de fútbol. Recuperado de http://www.consultoraequis.com/
7. Fabbri, Alejandro (2008). Historias Negras del Fútbol Argentino. Buenos Aires: Capital Intelectual.
8. Garicano, L., Palacios-Huerta, I., & Prendergast, C. (2005). Favoritism under social pressure. The Review of Economics and Statistics, 87 (2), 208-216.
9. Hart, O., & Holmström, B. (1987). The Theory of Contracts. En Bewley, T. F. Advances in Economic Theory: Fifth World Congress of the Econometric Society (pp. 71-155). Cambridge: Cambridge University Press.
10. Johnston, R. (2008). On referee bias, crowd size, and home advantage in the English soccer Premiership. Journal of Sports Sciences, 26 (6), 563-568.
11. Knowles, J., Persico, N., & Todd, P. (2001). Racial bias in motor vehicle searches: Theory and evidence. Journal of Political Economy, 109 (1), 203-229.
12. Lucey, B. M., & Power, D. A. (2009). Do football referees display home bias? Recuperado de http://ssrn.com/abstract=552223
13. Nevill, A. M., Balmer, N. J., & Williams, A. M. (2002). The influence of crowd noise and experience upon refereeing decisions in football. Psychology of Sport and Exercise, 3 (4), 261-272.
14. Pettersson-Lidbom, P., & Priks, M. (2010). Behavior under social pressure: Empty Italian stadiums and referee bias. Economics Letters, 108 (2), 212-214.
15. Sargan, J. D. (1958). The estimation of economic relationships using instrumental variables. Econometrica: Journal of the Econometric Society, 26 (3), 393-415.
16. Stock, J. H., & Yogo, M. (2005). Testing for weak instruments in linear IV regression. En Andrews, D. W. K., & Stock J. H. (Eds.). Identification and nference for Econometric Models: Essays in Honor of Thomas Rothenberg (pp. 80-108). New York: Cambridge University Press.
17. Sutter, M., & Kocher, M. G. (2004). Favoritism of agents-the case of referees' home bias. Journal of Economic Psychology, 25 (4), 461-469.
© 2018 por los autores; licencia otorgada a la revista Estudios Económicos. Este artículo es de acceso abierto y distribuido bajo los términos y condiciones de una licencia Atribución-No Comercial 3.0 Unported (CC BY-NC 3.0) de Creative Commons. Para ver una copia de esta licencia, visite http://creativecommons.org/licenses/by-nc/3.0
