


Servicios Personalizados
Articulo
 pdf en Inglés
 Articulo en XML
 Referencias del artículo
 Permalink
Estudios Económicos
versión On-line ISSN 2525-1295
Estud. Econ. vol.36 no.73 Bahía Blanca jul. 2019
Technological diffusion dynamics in developed and developing economies: an analysis for the Information and Communication Technologies (ICT)°
Dinámica de la difusión tecnológica en las economías desarrolladas y en desarrollo: un análisis de las tecnologías de información y comunicación (TIC)
Adriano Cristian Gewehr* - Janaina Ruffoni* - Alexsandro Marian Carvalho*
* Universidade do Vale do Rio dos Sinos (UNISINOS). South of Brazil. Email: tenoacg@yahoo.com.br Email: jruffoni@unisinos.br, alexsandromc@unisinos.br
enviado: 30 diciembre 2018
aceptado: 08 mayo 2019
Abstract
How are the diffusion process dynamics of the ICT in developed and developing countries? The research was based on the Bass model (1969) and used the empirical consumption data for the G7 and BRICS. The main results were: i) the model adjusted the diffusion curves with low error rates [0.2%-5.1%]; ii) no direct relationship between the speed and development level was found; iii) developed countries have reached the inflection point in the diffusion process before developing countries; iv) in some countries only approximately half of the population will get access to the Internet. In developing countries, the process to capture new adopters is slow, and while developed countries are reaching saturation, in most of the developing countries these technologies still have potential for diffusion.
JEL Code: O31, O33, C6.
Keywords: Diffusion; Innovation; Developed Countries; Developing Countries.
Resumen
¿Cómo es la dinámica del proceso de difusión de las TIC en los países desarrollados y en desarrollo? La investigación se basó en el modelo Bass (1969) y utilizó los datos de consumo empírico para el G7 y los BRICS. Los principales resultados fueron: i) el modelo ajustó las curvas de difusión con tasas de error bajas [0,2% -5,1%]; ii) no hay relación directa entre la velocidad y el nivel de desarrollo; iii) los países desarrollados han alcanzado el punto de inflexión en el proceso de difusión antes que los países en desarrollo; iv) en algunos países solo aproximadamente la mitad de la población tendrá acceso a internet. En los países en desarrollo, el proceso para captar nuevos adoptadores es lento, y mientras los países desarrollados están alcanzando la saturación, en la mayoría de los países en desarrollo estas tecnologías aún tienen potencial para la difusión.
Código JEL: O31, O33, C6.
Palabras clave: Difusión; Innovación; Países Desarrollados; Países en Desarrollo.
Introduction
Internet and mobile telephony have drastically changed competitiveness, because the sales of products, the information transactions, and the level of production costs were highly affected by the introduction of these two innovations (Grazzi and Jung, 2019; Delina and Tkac, 2015; Falk and Hagsten, 2015; Gruber and Koutroumpis, 2011; Vu, 2011). Therefore, understanding how these technologies spread in different economies is critical to innovation studies. There is a relative amount of research studies which explore the identification of diffusion determinants of these technologies. However, the exploration of the determinants reveals some limited aspects of the diffusion dynamics. Such analysis does not describe the diffusion process in a way that allows the understanding of "how much and how" these technologies have grown in a determined population of a specified economic context, besides predictive interferences.
Thus, the following problem still needs to be solved: what are the dynamics of the diffusion process for the Internet and mobile telephony technologies in developed and developing countries? This research aims to comprehend the dynamics of the diffusion process of the Internet and mobile telephony technologies for a selection of developed and developing countries (G71 and BRICS2, respectively). The specific objectives are: 1) to estimate the parameters of innovative and imitator adopters and the asymptotic3 state of each technology for each nation; 2) to analyze the accuracy of the Bass model (1969), and to adjust the diffusion curve of these technologies, comparing the empirical data of consumption to the adjusted curve of the model; 3) to examine the diffusion speed4 of these technologies; 4) to project the growth capacity of these technologies, as well as to estimate the inflection points; 5) to analyze how the results contribute to the comprehension of the countries' technological progress.
It is important to note that the information and communication technologies (ICT) accelerate the socialization process of other innovations (Jorgenson and Vu, 2016; Santoleri, 2015; Vu, 2011; Prince and Simon, 2009; Deroïan, 2002). The World Bank (2008) has also reported that the ICT accelerate the diffusion of other technologies, especially in the developed world.
I. Innovations diffusion: an approach to the ICT
The diffusion of an innovation is a "(...) process in which an innovation is communicated through certain channels over time among the members of a social dimension of the system" (Rogers, 2003, p.5). Innovations, when introduced, generate imbalances in the system, a fundamental phenomenon to the economic development in the view of Schumpeter (1912), while "the diffusion (propagation) of new technology or new knowledge generates a stabilizing effect, restoring the competition conditions" (Godinho, 2003). Going back to studies of Schumpeter (1942), capitalism would disappear without the constant search for monopoly profits, even if temporarily, there is no competitive process without the emergence and permanent overcoming of some monopolistic aspects.
The ICT brought relevant impacts for the industry structures: i) the increase of productivity (Paunov and Rollo, 2016); and ii) the reduction of the transaction costs, because the Internet provided access to information, creating blockades to certain forms of price discriminations (Bocquet, Brossardt, and Sabatier, 2007). Due to the fast diffusion of mobile telephony and the Internet, socioeconomic effects occur, of which the following could be emphasized: i) extremely short life cycles for the products (Day, Schoemaker, and Gunther, 2004); ii) facilitated incremental innovations, especially of processes (Bertschek, Polder, and Schulte, 2019; Paunov and Rollo, 2016); iii) greater competition, and thus, new ways of producing organization, remodeling in trade and consumption companies (Grazzi and Jung, 2019; Miller and Atkinson, 2014; Waverman, Meschi, and Fuss, 2005). These effects are directly linked to the emergency of business renovation. The following table summarizes the empirical review made in the scope of the ICT diffusions:
Table 1. Summary of empirical research studies about the diffusion of ICT
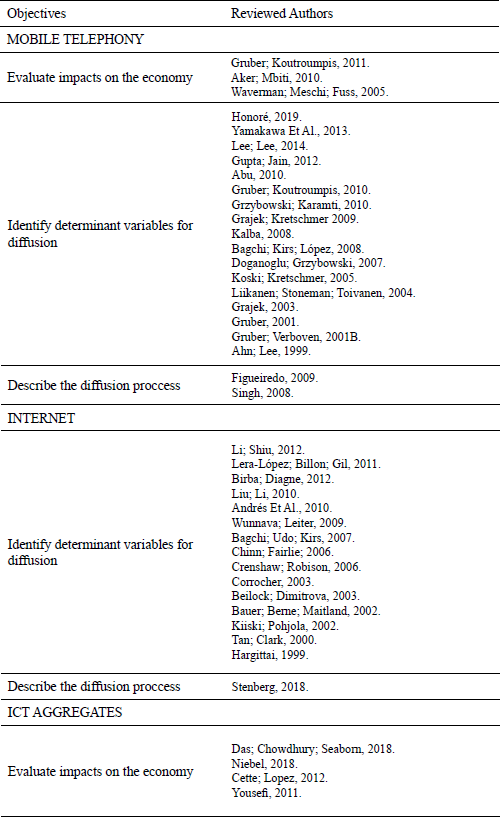
Source: Own elaboration.
From the empirical review, two hypotheses emerged to be ascertained in the diffusion of the mobile telephony and Internet technologies: 1) countries that belatedly adopted these technologies obtained higher speeds of diffusion; and 2) developed countries tend to: i) have a greater number of innovator adopters in its population; ii) achieve the rate changes faster - this happens when the increment of new adopters changes from increasing to decreasing.
Finally, it is worth emphasizing here that, notably, the efforts of the research studies on the mobile telephony and Internet diffusions intended to: i) identify the determinants which influence its adoption (higher incidence); and ii) evaluate the impacts on the economy. In this way, it is noticed that the efforts aimed to comprehend the diffusion process are minimum, investigating the behavior and growth by mathematical models.
II. Method
According to Rogers (1962), there is a standard behavior in the diffusion of innovations in social systems, proposing that the process begins with a period of slow growth, followed by a faster expansion, passing by another period of slow growth. It means that the dynamics of new adopters n(t) does not increase or decrease indefinitely, on the contrary, it is increased at a given time:
Adding the number of new adopters5 in the range of time 0 ≤ t ≤, there is a T number of adopters accumulated on the T time, or only, adopters of the N(T) time. Different from new adopters, the dynamics of the adopters does not have the concavity. It moves between the concave (0 ≤ t < T*) and the convex (t > T*) concavities, characterized by the inflection6 in T* (see Figure 1). That is, if in the range 0 ≤ t < T*, the number of new adopters increases at a faster rate. If t > T*, the number of new adopters increases in a slower rate. However, when t = T*, there occurs a change in the growth rate of the number of adopters (faster→slower). In this aspect, the inflection controls the rates in which technology is adopted by the population. Besides, it is seen that the adopter's dynamics are over on the limit in which t→∞ This note is necessary, once it associates a final number of adopters. This number, in turn, measures how successful the diffusion of innovation is in the population. The affirmations above are enough, according to Rogers (1962), to justify the behavior of the S-type for the diffusion of different technologies.
Figure 1. S shape of the growth of an innovation
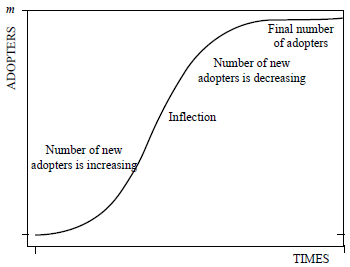
Source: Own elaboration based on Rogers (1962).
One of the first successful mathematical models to quantify Rogers' model (1962) was proposed by Bass (1969). In this model, a constant population divided between adopters (N) and non-adopters (NA)7 should be considered, homogeneously mixed and interacting in continuous time. The dynamics between the groups proceed in such a way that a non-adopter individual becomes an adopter based on: i) the innovation rate (p), the innovators; ii) the imitation rate (q), and the imitators. In this context, Bass (1969) has proposed that the adoption process is conducted mainly by the imitators (those who act due to the internal influence of the social system, e.g. contact, the word-of-mouth recommendation), and innovators (those who act only by external influence, e.g. media). Equating the proposition of Bass (1969), the following differential equation is obtained:
 | (1) |
in which: (p) is the parameter of innovator adopters; (q) is the parameter of imitator adopters; m is the final number of total adopters (saturation point or asymptotic state); N(t) and n(t) are the numbers of total adopters and new adopters, respectively, in the time. The values of the p, q, and m parameters are relative numbers, that is, they represent the population percentual of a country. Equation (1) is a First-Order Ordinary Differential Equation. Thus, given the initial condition N(0) = N0 , the solution N(t) can be obtained by the integration. Once N(t) is known, it is possible both to quantify the dynamics of new adopters and to express analytically the inflection point, as described on Table 2:
Table 2. Equations for the dynamics of the diffusion process according to Bass (1969).
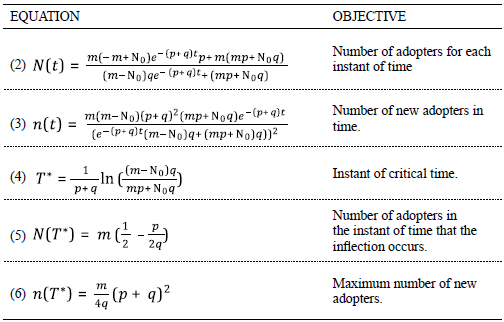
Source: Own elaboration based on Bass (1969).
The equations of Bass (1969) reproduce the dynamics suggested by Rogers (1962). Also, it is noticed that the analytical solutions shown for the dynamics of new adopters and adopters have an exponential dependency  . The rate at which the exponential term tends to zero, in time, grows with the increase of the value of p + q. From this confirmation, it is possible to observe that such coefficient controls the speed in which the technology is widespread. In the context of this problem, it can be concluded that the speed of the diffusion is directly proportional to the sum of innovation and imitation rates.
Despite the age of the model, its applications and mathematical properties are still valid at present. In fact, nowadays, a lot of research studies have been dedicated to: i) revalidate it (Krishnan and Jain, 2006; Lehman and Esteban-Bravo, 2006; Krishnan, Bass, and Jain, 1999; Bass, Krishnan, and Jain, 1994); and ii) use it for prediction of demand for new products, estimate saturation points of specific technologies and even for optimization of inventories in the industry (Porath and Schaeffer, 2014; Phuc, Vincent, and Chou, 2013; Turk and Trkman, 2012.) Regarding the models for the innovation diffusion, the one developed by Bass (1969) is the most used in all history, accounting approximately 7,000 citations at the moment this research was conducted.
Given the time series of the number of adopters from different technologies, the objective is to find the best adjustment curve characterized by equation (2). Therefore, the curve should be determined by the set of parameters for p, q, and m that optimize the adjustment. These optimized parameters will be determined with the help of the software Mathematica (Mangano, 2010). In particular, the minimum squares method8 was selected. In order to compare how much the empiric data differ from the typical behavior of diffusion for the adopters ("S" curve), proposed by Rogers (1962), the equation was linearized (7). From this, the following equation emerges:
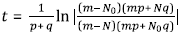 | (7) |
in which p, q, and m are the parameters of the innovator and imitator adopters, and the final number of total adopters; N0 represents the value of the amount of adopters for the instant of time zero of the historical series (1990); N represents the value of the number of adopters in a determined moment of time t between the years of 1990 and 2014. It is observed that equation (7) deals with a straight identity, t = t(N). Therefore, the more the empirical data are grouped around the line, the more the diffusion of different technologies in several countries will be approximate to the Bass (1969) model.
The data base9, i. e. the consumption of mobile telephony and Internet of the analyzed countries, was extracted from ITU10 (International Telecommunication Union). The relevance of this data base can be verified in several research studies related to the theme, many of them used in economy (Lee and Lee, 2014; Gupta and Jain, 2012; Gruber and Koutroumpis, 2011; Chinn and Fairlie, 2006; Waverman, Meschi, and Fuss, 2005; Kiiski and Pohjola, 2002; Bauer, Berne, and Maitland, 2002; Gruber and Verboven, 2001ª; Röller and Waverman, 2001; Hargittai, 1999; Ahn and Lee, 1999.) The period selected for analysis includes the interval from 1990 to 2014. It is observed that the time series seems to be adequate, since the first period coincides with the year in which consumers in the vast majority of the countries could have access to these technologies for the first time. According to Grajek (2003), in the majority of the nations, these types of technologies were available for the consumers only at the beginning of the 1990s.
Because the data used incorporate the market dynamics  , then, the precision of our future findings can be extended for outputs using the number of users. In order to present a quantitative test for the demonstration of this statement, we suggested the following exercise: suppose that N(t) lines are in use at time t for a constant density η of lines per users over time. Consequently, the number of users at time t is given by U(t)= N(t)/η. Considering that the number of lines is ruled by the Bass (1969) model, it is possible to conclude, by the algebraic structure of the equation, that N(t) and U(t) are ruled by equivalent diffusion processes. In other words, the equation associated with the inflection point shows that it is invariant against the 1η scale factor. Observe that, even in a scenario where η is stochastic (closer to reality), and that each time instant η is randomly drawn according to a probability distribution, the invariance between the results is proven.
Two other hypotheses still need to be validated: 3) the dynamics of the technologies diffusion - object of study of this research - follows the "S" shape for the total number of adopters proposed by Rogers (1962), independently of the economic context, only changing the inclination; and 4) The Bass model (1969) describes the process of diffusion for these technologies with accuracy, that is, with few error margins.
III. Results
The following panels, on Figure 2 and Figure 3, show, from left to right, the linearization tests and the parameters found for each nation regarding the mobile telephony and Internet technology, respectively. The first graphic corresponds to the G7 grouping and, right below, to the BRICS.
Figure 2. Linearization and parameters of the model to the technology of mobile telephony
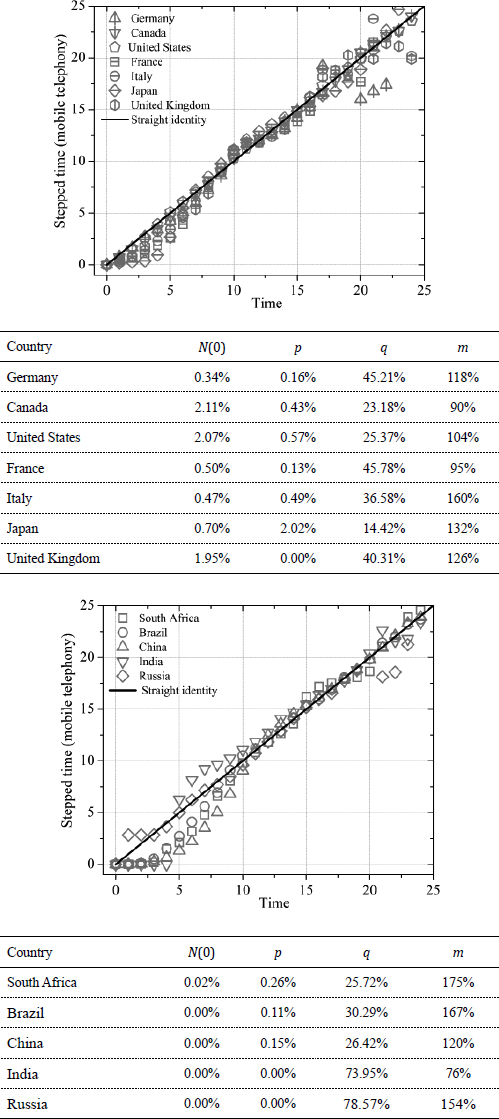
Source: Own elaboration based on ITU (1990-2014).
Figure 3. Linearization and parameters of the model to the technology of the Internet
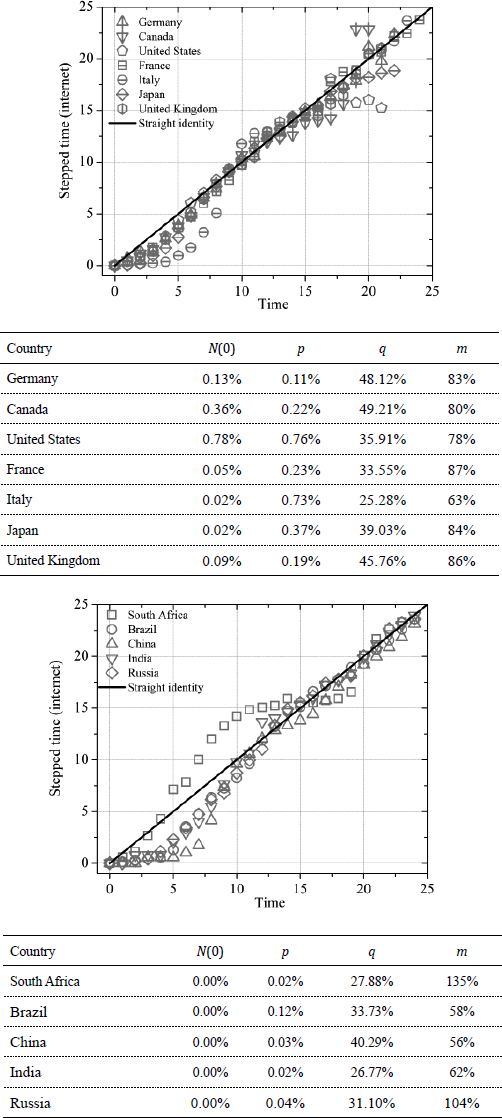
Source: Own elaboration based on ITU (1990-2014).
Three interferences emerge from the graphic analysis of the linearization: i) the model is effective to describe the diffusion process of these two technologies; ii) in developing economies, the model has greater difficulties of adjusting the curve in the beginning of the diffusion; and iii) in developed economies, the model shows greater difficulties in adjusting the curve closer to the end of the dynamic. To measure the adjustment curve quality according to the empirical data, the average error ⟨NE⟩11 and the standard deviation σNE were defined by the following equations, respectively:
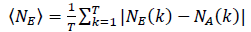 | (8) |
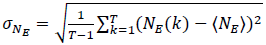 | (9) |
in which NE (k) is the number of adopters on the instant k (empirical), is the number of adopters on the instant k (adjustment) and T =25 refers to the time span of observation of the temporal series. Table 3 below ranks the average errors and the respective standard deviations of the adjusted curve for the mobile telephony technology on each analyzed country according to the model in front of the empirical data:
Table 3. Error and standard deviation of the adjusted curve regarding the empirical data for the Mobile Telephony technology
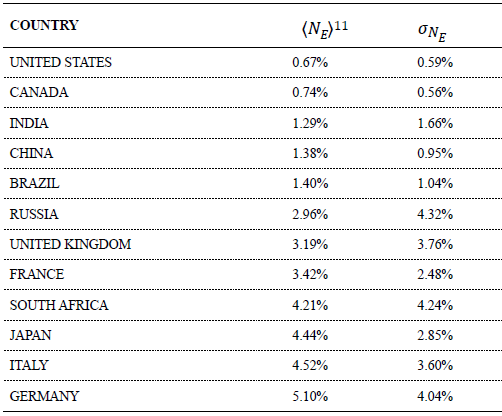
Source: Own elaboration based on ITU (1990-2014).
It can be observed that, for the mobile telephony technology, among the four smaller errors, there is the presence of two developed economies and two developing ones: the United States, Canada, India, and China, respectively. It is salient that, regarding those two smaller errors from the developed economies, the model generates an error of less than 1%. The four most significant errors are found in South Africa, Japan, Italy, and Germany, respectively. Next, Table 4 ranks the smallest average errors and the respective standard deviations of the adjusted curve for Internet technology:
Table 4. Error and standard deviation of the adjusted curve regarding the empirical data for Internet technology
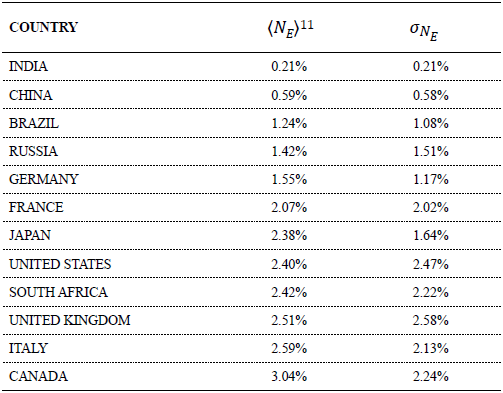
Source: Own elaboration based on ITU (1990-2014).
In Internet technology, only developing nations are among the four smaller errors: India, China, Brazil, and Russia, respectively. As it is possible to observe, in the four referred countries, the error is not higher than 1.5%. In regards to the four most significant errors, one developing country and three developed ones correspond to them: South Africa, United Kingdom, Italy, and Canada, respectively.
With an error amplitude of only 4.43% for the mobile telephony technology and only 2.83% for the Internet, it is not necessary to generate all the twenty-four11 graphics of "S" curves of the dynamics of diffusion. Therefore, two figures are presented, with the adjusted curve by the model vs. empirical data, following this criterion: smaller or bigger average error measured by technology, per group. Figure 4 presents the graphics of the smallest errors, and Figure 5, the biggest errors, in which each graphic displays from left to right the groups (BRICS and G7, respectively), and from above to below, the technologies (mobile telephony and Internet, respectively).
Figure 4. Model adjustment vs. empirical data: smallest error
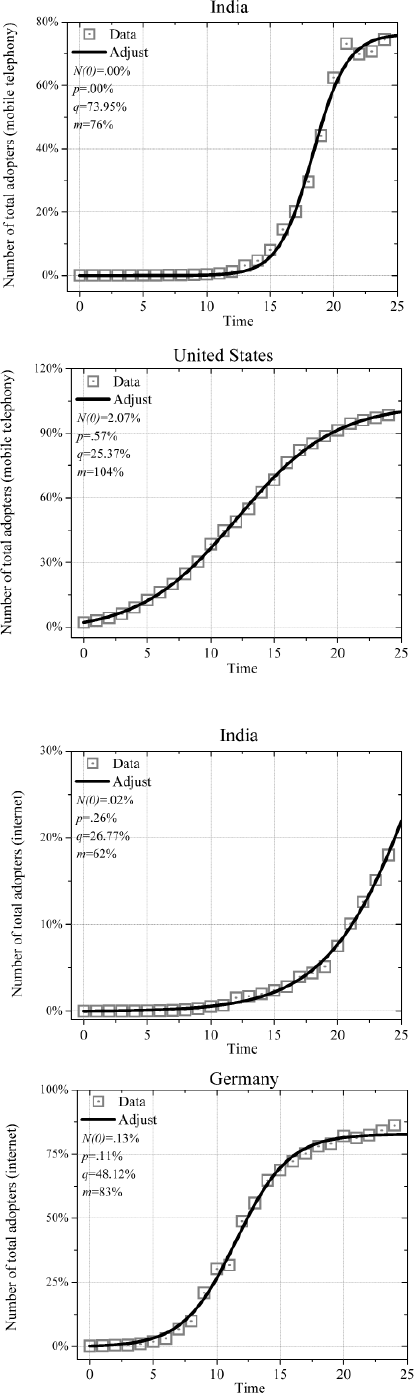
Source: Own elaboration based on ITU (1990-2014)
Figure 5. Model adjustment vs. empirical data: biggest errors
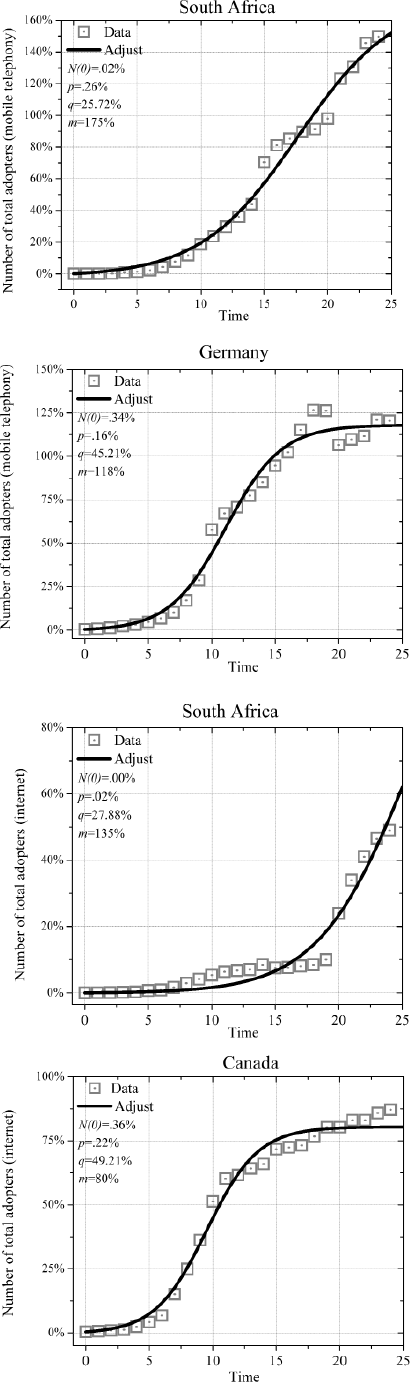
Source: Own elaboration based on ITU (1990-2014)
As it is possible to observe from the average errors and standard deviations measured and shown on the previous table, complemented now with graphics analysis, the Bass model (1969) approximates satisfactorily to the empirical data for these types of technologies.
From the previous table, it is possible to see that, when the diffusion curve of these technologies is adjusted, the model has fewer errors in the developing economies than in the developed ones. Besides, it fits better to the Internet data.
It is important to note that the indicator used is about density and, therefore, does not distinguish between different technologies in the time series evaluated. So, this indicator represents the natural sum of all technologies, and any effects of these (3G/4G) have already been verified within simulations. Next, we investigated the speeds of these technologies for each country.
The diffusion speed of new technology is directly related to the adoption rate, i. e. the variation in the number of adopters on the period of one year in the temporal series is taken as a sample in the research. The evaluation of this speed, according to Tigre (2002), has fundamental importance to marketing studies and serves as parameters for the establishment of goals and monitoring of public policies.
The instantaneous speed was measured by the numerical derivative of the empirical data, and the finite differences method is appropriate for this (Franco, 2006). According to this algorithm, the derivative can be approximated as follows:
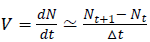 | (10) |
in which Nt is the number of adopters on the instant t; Nt+1 is the number of adopters on the instant that follows the instant t; and Δt is the range of time (in particular Δt = 1 year ). Thus, it is observed that each temporal series associated to the number of adopters generates another series of corresponding data to the instantaneous speed. To avoid the observation of all series, an average value was characterized (average speed) and, therefore, its respect standard deviation, shown in the following equations:
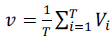 | (11) |
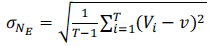 | (12) |
in which T = 25 years, corresponding to the observation time of the series. Next, Table 5 ranks the highest average speeds for the technology of mobile telephony:
Table 5. Speed of diffusion of the mobile telephony technology
Source: Own elaboration based on ITU (1990-2014).
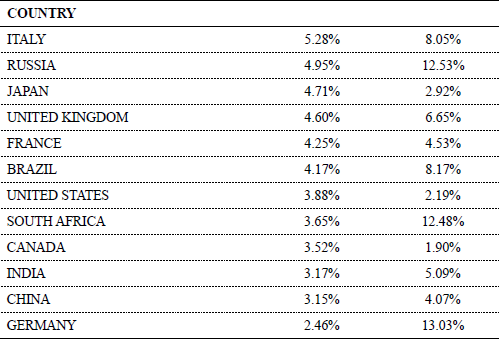
Italy has the highest speed, while Germany has the lowest average speed over the 25 years analyzed. An average of 5.28% adopters/year and an average of 2.46% adopters/year can be observed, respectively. Table 6 classifies the nations according to the highest average speeds for Internet technology:
Table 6. Diffusion speed of Internet technology
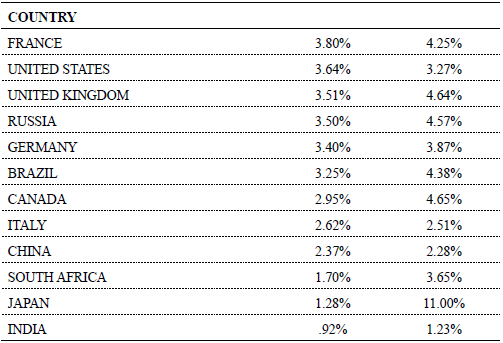
Source: Own elaboration based on ITU (1990-2014).
Notoriously, for the Internet, the number of adopters per year is much closer to the average value, which suggests a more homogeneous diffusion. France has the highest average speed with 3.80%/year and India has the lowest average speed of .92%/year. It can be observed that there is not a possibility of forming a grouping by homogeneity regarding economic contexts in either technologies. It is also possible to emphasize that there is not a direct relation between the speed and the development levels of the economies analyzed. It is important to remember that, regarding the growth capacity of these technologies for each country and the inflection points estimated, the instant of time zero of the time series, in general, is not the instant in which the number of adopters is zero. However, it is very close, since most of the countries had less than 1% of their populations in 1990's consumption.
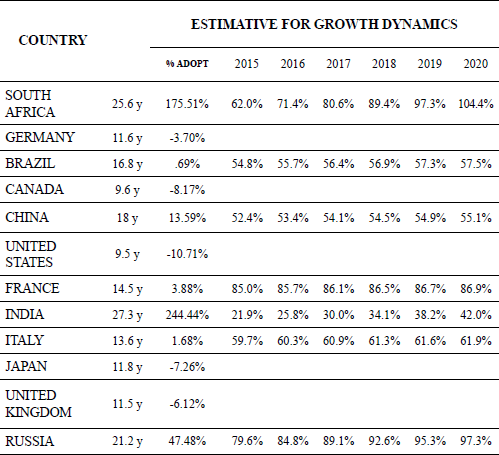
Tables 7 and 8 below present, for each nation, the projections of mobile telephony and Internet, respectively, listing from left to right: i) the inflection point from 1990; ii) how much this technology can still grow regarding the universe of adopters (m / N (2014)-1); and iii) projections for the next six years of the final relative number of total adopters (m). The fact that the year 2015 is a projection should be emphasized, though, considering that the database used provides empirical data until 2014. Since the present research was executed during 2015, there was no data for this year yet.
Table 7. Projections for the technology of mobile telephony
Source: Own elaboration based on ITU (1990-2014).
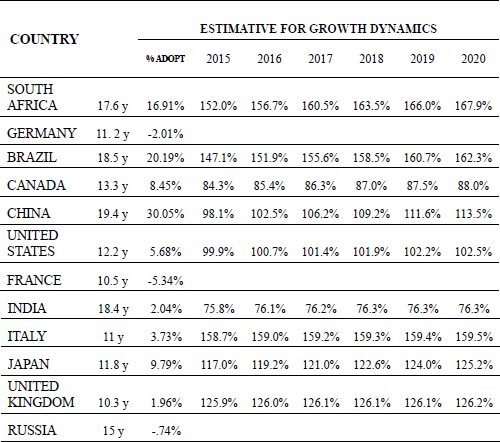
Table 8. Projections for Internet technology
Source: Own elaboration based on ITU (1990-2014).
In regards to the inflection, it is possible to observe that, in the developing economies, this technology takes, in average, 18 years to achieve inflection (to change the rates from increasing to decreasing), while in the developed economies, this phenomenon takes, in average, 11 years to happen. The countries that achieved the inflection the fastest are all from G7, as follows: 1°) the United Kingdom; 2°) France; 3°) Italy; 4°) Germany; 5°) Japan; 6°) the United States; 7°) Canada.
On the table above, it is possible to verify that one developing country and two developed ones, respectively, Russia, Germany, and France, have superior values in comparison to the final value previewed by the model for their adopters' populations. It is observed that the model provides a lower estimative for the total amount of adopters than the empirical data in 2014, (m<N(2014)). In these nations, a decrease in the number of adopters is expected. Apart from these three countries mentioned above, the estimation for the rest of the nations is an increase in the number of adopters.
It is verified that the nations with higher perspectives for growth of this technology are China, Brazil, and South Africa, which are all developing economies. The projections for Internet technology are presented below:
It is possible to observe that, in the developing economies, Internet technology takes, in average, 22 years to achieve the inflection, while in the developed economies, this effect takes, in average, 12 years to occur. Again, the countries that achieved the inflection faster are all from G7: 1°) the United States; 2°) Canada; 3°) the United Kingdom; 4°) Germany; 5°) Japan; 6°) Italy; 7°) France.
On the table above, it is possible to verify that almost all the developed economies, like Germany, Canada, the United States, Japan, and the United Kingdom, have superior values in comparison to the final value previewed by the model for their adopters' populations. In these nations, a decreasing number of adopters is expected. For the rest of the nations, an increase in the number of adopters was estimated. South Africa, India, Russia, and China were identified as nations with a higher perspective of growth. All of them are developing economies.
Regarding the results of this research study compared to the ones already developed in the area, according to Gruber (2001), countries that adopted the mobile telephony lately have most prominent speeds of diffusion. However, this research was restricted to the central and eastern regions of Europe, and some evidence of these assumptions are not noticeable in the results found in this study, since countries that adopted mobile telephony lately (as India and China) are among the economies that show the lowest speeds (except for Russia). It was verified that countries that adopted mobile telephony belatedly, like Russia and India (which started adopting it in 1991 and 1994, respectively), have the highest parameters of imitator adopters among all investigated nations.
Notably, in developing countries, the parameter (m) indicates that there will be around 1,5 mobile phone subscriptions (lines) per person or more (except for India). In developed countries, the final number of total adopters will not achieve such levels (except for Italy). This is perfectly acceptable and explicable by studies from: i) Grzybowski and Karamti (2010), who show that in developed countries the mobile telephony is complementary to fixed telephony; and ii) Waverman, Meschi, Fuss (2005), who show that the mobile telephony is a substitute for fixed telephony in developing economies.
Regarding the Internet, it was verified that Internet diffusion has the highest speeds in the following countries: 1°) France; 2°) the United States; 3°) the United Kingdom; 4°) Russia; 5°) Germany, which are all developed, except for Russia. The reviewed studies agree that the per capita income is the main factor, which explains the increase in the rates of use. However, the biggest per capita incomes in 2014 are: 1°) the United States; 2°) Canada; 3°) Germany; 4°) the United Kingdom; and 5°) France (World Bank, 2015). This parallel hints at the fact that the per capita income is not necessarily going to be the primordial factor for the diffusion of this technology in all of the economic contexts. This paper does not intend to state that this variable would not influence or does not have any importance. On the contrary, it just shows that, in specific contexts, it can lose its intensity, being accompanied by other variables that influence the adoption of this technology. After all, among the five fastest speeds observed, one is from a developing economy, and four of them have the biggest per capita incomes. However, there is not necessarily a hierarchical link between these two elements.
Andrés et al. (2010) have commented that the low-income countries where the diffusion started belatedly would be making use of higher speeds. This finding is questioned by the results presented here, since the nations that adopted the Internet belatedly (all from BRICS and notably some low per capita income nations) are not ranked among the highest speeds (except, again, for Russia).
According to the observation on estimates of the final number of total adopters (m), it was noted that in several nations, almost half of the population will not adopt the Internet. That is the case of one developed economy (Italy) and three developing ones (China, Brazil, and India).
Conclusion
The research identified a set of contributions regarding the dynamics of diffusion of the ICT, considering that: i) the empirical review made has verified that the research efforts concentrate on identifying the diffusion determinants; and ii) it went through outstanding efforts to evaluate this dynamic for a set of developed and developing countries. Therefore, it is useful to understand how such dynamics can contribute to the comprehension of the technological progress.
The dynamic of diffusion of the ICT for the set of countries evaluated has shown the same behavior proposed by Rogers (1962) for all innovations: a curve in the "S" shape overtime, which shows particular characteristics in each economic context. The research also verified what Bass (1969) proposed on imitator adopters having more influence on the diffusion of new technologies. The results demonstrate that: i) the fraction of a population of imitator adopters is considerably superior to the fraction of innovator adopters; ii) Russia, whose parameter was very close to zero, but whose parameter was 78.5% (notably higher than the rest), is the country with the second highest speed in mobile telephony technology, and has its inflection point anticipated in a minimum of three years, in comparison to the similar economies (BRICS group).
It was observed that, in both technologies analyzed, the countries that appear among those with the greatest parameters are developed countries. This proves that countries with higher per capita income tend to have more adopters of the innovator type in the population. In other words, in this context, the individuals are more open to the adoption of some new technology in the market (Dickerson and Gentry, 1983).
The study also verified that: i) the developed countries analyzed achieved the inflection point of the diffusion process before the developing ones; ii) in most of the developing economies, these technologies still have capacity for diffusion; and iii) five of the greatest economic powers have already achieved saturation in Internet adoption, except for France and Italy, which still have room to grow.
In general, it is possible to observe that, in developing economies, it takes much more time to capture the maximum of new adopters per year. While the developed countries are already achieving saturation, in the majority of these developing economies the technologies still have much room to grow. Considering this and the fact that the two technologies analyzed tend to contribute to the diffusion of other innovations, the problem of the slow technological progress tends to be aggravated in developing economies.
Regarding the estimative of the final number of adopters, it has been verified that, in developing economies, there is a strong tendency to occur very close averages of 1,5 to 2 lines of mobile telephone per individual, while in two developed economies, France and Canada, there will not be even one line of mobile telephone per inhabitant. The parameter on the mobile telephony of developing countries denotes what is expected, given the conditions of investment in infrastructure and inefficiency of these nations: higher levels of demand increase the number of adopters (Van Der Boor, Oliveira and Veloso, 2014; Urban and Von Hippel, 1998).
The model's predictions in terms of the final number of adopters demonstrate the existence of a gap when it comes to access to a certain technology, which, among the referred technologies, can implicitly be understood as access to information. In countries like Brazil, China, India, and Italy, only a little bit more than half of the population have gotten Internet access. The non-dissemination of this technology in its totality would entail technological delay and less growth, given the evidence of those who verified the Internet as an accelerator of other innovations (Prince and Simon, 2009).
In regards to the speeds, it has been observed the non-existence of a standard cluster, which could be formed from the relationship between the economic contexts and the speeds. This research was able to verify the existance of a paradox, considering that it is not possible to find support for the affirmation that nations that belatedly adopt these technologies tend to have higher speeds, as pointed out by the empirical review. At least, that does not seem to be the case of these two technologies. Notoriously, all of the countries from BRICS are the ones that belatedly adopted the technologies that here are objects of investigation (see empirical data of 1990 to 2005). However, they do not appear as the five highest speeds.
The lack of consensus about what the technology speed is can be noted, here used as an average of new adopters, that is, defined as a look on the marginal behavior, not strictly on a final level of adoption. In the end, it is still worth mentioning that: i) the countries that belatedly adopted these technologies (all from BRICS) take longer to achieve the inflection point in both technologies; and ii) the developed countries with earlier adoptions evaluated here have achieved the inflection point faster.
The model has proved to be useful as a tool of prediction to adjust the curves of diffusion of these technologies with a lower index of errors12, which over 25 years have been between [.2% and 5.1%], in average. Imagine the importance of a demand preview (main input in scenario analysis for definition of ROI13) with only [.2% - 5%] of error for a firm, or for the government, as a way to guide expenses on infrastructure or even to anticipate situations (market-competition regulation, tax enforcements), especially by observing the parameter (m). Through the information provided by the model and using empirical data, it is still visible the utility to guide the decision-making of entry, exit or even keeping of a technology or a product in a specific market.
It was verified that the model adequately describes the technology diffusion process, using the data of consumption (adoptions) available. Considering the model of Bass (1969), it is enough to get the fraction of a population that adopted/consumed some technology. Geroski (2000), in a literature review regarding the diffusions' models, affirmed: "it is difficult to dispute the relevance of the Bass model (1969). It provides subsidies to help policymakers and it can be useful as a tool to formulate public policies" (Deroïan, 2002; Geroski, 2000).
In general, structured analysis of the innovation diffusion process such as the one carried out in this research can help: i) company managers to minimize errors in scenario analyses regarding demand estimatives for new products and in the formulation of strategic planning; ii) firms to potentialize predictions of market, income, profit and growth capacity sizing; and iii) government leaderships to formulate their technological and/or industrial policies.
In terms of limitations, it should be noted that, in a level of projections, the larger the temporal series, the more assertive the projections will be. Besides, they are more precise on the short term; long-term projections can be contested in regards to changes in the consumption profile, which entails running the model again to get new projections. This kind of limitation does not revoke in any way the main results obtained regarding the shape of the curves that characterize the dynamics of diffusion in each development level and the speeds.
In future studies, we suggest obtaining database of consumption about each ICT evaluated in each country analyzed in this study, separated by type of technology (2G, 3G, 4G among others), for an evaluation on how these technologies may impact the speed and reach the inflection point. Zaber e Sirbu (2012) also used econometrics to evaluate the influence of the diffusion levels of previous generations and management or regulatory policies on this spectrum. Therefore, it is possible to prove how these technologies can change the behaviour of ICT diffusion in each country, predicted in classic models.
Notas
° Gewehr, A. S., Ruffoni, J. & Carvalho, A. M. (2019). Technological diffusion dynamics in developed and developing economies: an analysis for the information and communication technologies (ICT). Estudios económicos, 36(73), 71-107.
1 Most industrialized democratic countries: USA, Germany, Canada, France, Italy, Japan, United Kingdom. Source: http://www.worldbank.org
2 Developing countries: Brazil, Russia, India, China, South Africa. Besides the continental countries, they are nowadays the greatest emergent economies. Source: http://www.worldbank.org
3 Saturation point.
4 Relationship between time and number of adopters.
5 If time is continuous, the sum is integral.
6 Rate change: the increment (in this case, the adopters of the innovation) goes from increasing to decreasing.
7 Individuals that have not adopted the innovation yet and can be new adopters.
8 Mathematical technique that aims to find a better adjustment for a data set, minimizing the sum of squares of the waste. Waste: the difference between the estimated value and the observations (empirical data).
9 Available in population percentual and in absolute numbers on the ITU.
10 http://www.itu.int/en/ITU-D/Statistics/Pages/stat/default.aspx.
11 12 countries x 2 technologies
12 Distance between the Y (adopters) value, determined by the model and the empirical value (actual consumption).
13 Return on investment.
References
1. Abu, S. T. (2010). Technological innovations and 3G mobile phone diffusion: Lessons learned from Japan. Telematics and Informatics, 27(4), 418-432. Recuperado de http://dx.doi.org/10.1016/j.tele.2010.03.001
2. Ahn, H., & Lee, M. H. (1999). An econometric analysis of the demand for access to mobile telephone networks. Information Economics and Policy, 11 (3), 297-305. Recuperado de http://dx.doi.org/10.1016/S0167-6245(99)00016-5
3. Aker, J. C., & Mbiti, I. M. (2010). Mobile phones and economic development in Africa. Journal of Economic Perspectives, 24(3), 207-32. Recuperado de http://dx.doi.org/10.1257/jep.24.3.207
4. Andrés, L., Cuberes, D., Diouf, M., & Serebrisky, T. (2010). The diffusion of the Internet: A cross-country analysis. Telecommunications Policy, 34(5-6), 323-340. Recuperado de http://dx.doi.org/10.1016/j.telpol.2010.01.003
5. Bagchi, K., Udo, G., & Kirs, P. (2007). Global diffusion of the internet XII: the internet growth in Africa: some empirical results. Communications of the Association for Information Systems, 19(1), 16.
6. Bagchi, K., Kirs, P., & López, F. (2008). The impact of price decreases on telephone and cell phone diffusion. Information & Management, 45(3), 183-193. Recuperado de http://dx.doi.org/10.1016/j.im.2007.12.005
7. Bass, F. M. (1969). A new product growth for model consumer durables. Management science, 15(5), 215-227. Recuperado de http://dx.doi.org/ 10.1287/mnsc.1040.0264
8. Bass, F. M., Krishnan, T. V., & Jain, D. C. (1994). Why the Bass model fits without decision variables. Marketing science, 13(3), 203-223.
9. Bauer, J. M., Berne, M., & Maitland, C. F. (2002). Internet access in the European Union and in the United States. Telematics and Informatics, 19(2), 117-137. Recuperado de http://dx.doi.org/10.1016/S0736-5853(01)00009-0
10. Beilock, R., & Dimitrova, D. V. (2003). An exploratory model of inter-country Internet diffusion. Telecommunications Policy, 27(3-4), 237-252. Recuperado de http://dx.doi.org/10.1016/S0308-5961(02)00100-3
11. Birba, O., & Diagne, A. (2012). Determinants of adoption of Internet in Africa: Case of 17 sub-Saharan countries. Structural Change and Economic Dynamics, 23(4), 463-472. Recuperado de http://doi.org/10.1016/j.strueco.2012.06.003
12. Bocquet, R., Brossard, O., & Sabatier, M. (2007). Complementarities in organizational design and the diffusion of information technologies: An empirical analysis. Research Policy, 36(3), 367-386. Recuperado de http://dx.doi.org/10.1016/j.respol.2006.12.005
13. Bertschek, I., Polder, M., & Schulte, P. (2019). ICT and resilience in times of crisis: evidence from cross-country micro moments data. Economics of Innovation and New Technology, 1-16. Recuperado de http://doi.org/10.1080/10438599.2018.1557417
14. Cette, G., & Lopez, J. (2012). ICT demand behaviour: an international comparison. Economics of Innovation and New Technology, 21(4), 397-410. Recuperado de http://doi.org/10.1080/10438599.2011.595921
15. Chinn, M. D., & Fairlie, R. W. (2007). The determinants of the global digital divide: a cross-country analysis of computer and internet penetration. Oxford Economic Papers, 59(1), 16-44.
16. Corrocher, N. (2003). The diffusion of Internet telephony among consumers and firms: current issues and future prospects. Technological Forecasting and Social Change, 70(6), 525-544. Recuperado de http://dx.doi.org/10.1016/S0040-1625(02)00322-0
17. Crenshaw, E. M., & Robison, K. K. (2006). Globalization and the digital divide: The roles of structural conduciveness and global connection in Internet diffusion. Social Science Quarterly, 87(1), 190-207.
18. Day, G. S., Schoemaker, P. J., & Gunther, R. E. (Eds.). (2004). Wharton on managing emerging technologies. New York: John Wiley & Sons.
19. Das, A., Chowdhury, M., & Seaborn, S. (2018). ICT diffusion, financial development and economic growth: new evidence from low and lower middle-income countries. Journal of the Knowledge Economy, 9(3), 928-947. Recuperado de http://doi.org/10.1007/s13132-016-0383-7
20. Delina, R., & Tkác, M. (2015). Role of e-business in the perception of ICT impact on revenue growth. Journal of Business Economics and Management, 16(6), 1140-1153. Recuperado de http://doi.org/10.3846/16111699.2013.797012
21. Deroian, F. (2002). Formation of social networks and diffusion of innovations. Research policy, 31(5), 835-846. Recuperado de http://dx.doi.org/10.1016/S0048-7333(01)00147-0
22. Dee Dickerson, M., & Gentry, J. W. (1983). Characteristics of adopters and non-adopters of home computers. JournalofConsumerresearch, 10(2), 225-235.
23. Falk, M., & Hagsten, E. (2015). E-commerce trends and impacts across Europe. International Journal of Production Economics, 170, 357-369. Recuperado de http://doi.org/10.1016/j.ijpe.2015.10.003
24. Figueiredo, J. C. B. (2009). Estudo da difusão da tecnologia móvel celular no Brasil: uma abordagem com o uso de Dinâmica de Sistemas. Production, 19(1), 230-245. Recuperado de http://dx.doi.org/10.1590/S0103-65132009000100015
25. Franco, N. B. (2006). Cálculo numérico. Pearson.
26. Geroski, P. A. (2000). Models of technology diffusion. Research policy, 29(4-5), 603-625.
27. Godinho, M. M. (2003). Inovação: conceitos e perspectivas fundamentais. Para uma Política de Inovação em Portugal, Biblioteca de Economia & Empresa, Dom Quixote, Lisboa, 29-51.
28. Grajek, M. (2003). Estimating network effects and compatibility in mobile telecommunications. WZB Discussion Paper No. SP II 2003 - 26. Recuperado de https://bibliothek.wzb.eu/pdf/2003/ii03-26.pdf
29. Grajek, M., & Kretschmer, T. (2009). Usage and diffusion of cellular telephony, 1998-2004. International Journal of Industrial Organization, 27(2), 238-249. Recuperado de http://dx.doi.org/10.1016/j.ijindorg.2008.08.003
30. Grazzi, M., & Jung, J. (2019). What Are the Drivers of ICT Diffusion? Evidence from Latin American Firms. Information Technologies & International Development, 15, 34-42.
31. Greenstein, S., & Prince, J. (2006). The Diffusion of the Internet and the Geography of the Digital Divide in the United States. NBER Discussion Papers No 12182.
32. Gruber, H. (2001). Competition and innovation: The diffusion of mobile telecommunications in Central and Eastern Europe. Information Economics and policy, 13(1), 19-34. Recuperado de http://dx.doi.org/10.1016/S0167-6245(00)00028-7
33. Gruber, H., & Koutroumpis, P. (2010). Mobile communications: Diffusion facts and prospects. Communications and Strategies, 77(1), 133-145.
34. Gruber, H., & Koutroumpis, P. (2011). Mobile telecommunications and the impact on economic development. Economic Policy, 26(67), 387-426. Recuperado de http://dx.doi.org/10.1111/j.1468-0327.2011.00266.x
35. Gruber, H., & Verboven, F. (2001). The evolution of markets under entry and standards regulation-the case of global mobile telecommunications. International Journal of Industrial Organization, 19(7), 1189-1212. Recuperado de http://dx.doi.org/10.1016/S0167-7187(01)00069-8
36. Gruber, H., & Verboven, F. (2001b). The diffusion of mobile telecommunications services in the European Union. European Economic Review, 45(3), 577-588. Recuperado de http://dx.doi.org/10.1016/S0014-2921(00)00068-4
37. Grzybowski, L., & Karamti, C. (2010). Competition in mobile telephony in France and Germany. The Manchester School, 78(6), 702-724.
38. Gupta, R., & Jain, K. (2012). Diffusion of mobile telephony in India: An empirical study. Technological Forecasting and Social Change, 79(4), 709-715. Recuperado de http://dx.doi.org/10.1016/j.techfore.2011.08.003
39. Hargittai, E. (1999). Weaving the Western Web: Explaining differences in Internet connectivity among OECD countries. Telecommunications policy, 23(10-11), 701-718. Recuperado de http://dx.doi.org/10.1016/S0308-5961(99)00050-6
40. Honoré, B. (2019). Diffusion of mobile telephony: Analysis of determinants in Cameroon. Telecommunications Policy, 43(3), 287-298. Recuperado de http://doi.org/10.1016/j.telpol.2018.08.002
41. ITU (2015). International Telecommunication Union Indicators Database. Recuperado de http://www.itu.int/en/ITU-D/Statistics/Pages/stat/default.aspx
42. Jorgenson, D. W., & Vu, K. M. (2016). The ICT revolution, world economic growth, and policy issues. Telecommunications Policy, 40(5), 383-397. Recuperado de http://doi.org/10.1016/j.telpol.2016.01.002
43. Kiiski, S., & Pohjola, M. (2002). Cross-country diffusion of the Internet. Information Economics and Policy, 14(2), 297-310. Recuperado de http://dx.doi.org/10.1016/S0167-6245(01)00071-3
44. Koski, H., & Kretschmer, T. (2005). Entry, standards and competition: Firm strategies and the diffusion of mobile telephony. Review of Industrial Organization, 26(1), 89-113.
45. Kalba, K. (2008). The adoption of mobile phones in emerging markets: Global diffusion and the rural challenge. International journal of Communication, 2, 631-661.
46. Krishnan, T. V., & Jain, D. C. (2006). Optimal dynamic advertising policy for new products. Management Science, 52(12), 1957-1969.
47. Krishnan, T. V., Bass, F. M., & Jain, D. C. (1999). Optimal pricing strategy for new products. Management Science, 45(12), 1650-1663.
48. Lera-López, F., Billon, M., & Gil, M. (2011). Determinants of Internet use in Spain. Economics of Innovation and New Technology, 20(2), 127-152. Recuperado de http://doi.org/10.1080/10438590903378017
49. Lee, S., & Lee, S. (2014). Early diffusion of smartphones in OECD and BRICS countries: An examination of the effects of platform competition and indirect network effects. Telematics and Informatics, 31(3), 345-355. Recuperado de http://dx.doi /10.1016/j.tele.2013.12.002
50. Lehmann, D. R., & Esteban-Bravo, M. (2006). When giving some away makes sense to jump-start the diffusion process. Marketing Letters, 17(4), 243-254. Recuperado de http://dx.doi.org/10.1007/s11002-006-7942-9.
51. Liikanen, J., Stoneman, P., & Toivanen, O. (2004). Intergenerational effects in the diffusion of new technology: the case of mobile phones. International Journal of Industrial Organization, 22(8-9), 1137-1154. Recuperado de http://dx.doi.org/10.1016/j.ijindorg.2004.05.006
52. Li, R., & Shiu, A. (2012). Internet diffusion in China: A dynamic panel data analysis. Telecommunications Policy, 36(10-11), 872-887. Recuperado de http://doi.org/10.1016/j.telpol.2012.06.004
53. Liu, Y., & Li, H. (2010). Mobile internet diffusion in China: an empirical study. Industrial Management & Data Systems, 110(3), 309-324.
54. Mangano, S. (2010). Mathematica Cookbook. "O'Reilly Media, Inc. ".
55. Miller, B., & Atkinson, R. D. (2014). Raising European productivity growth through ICT. ITIF, June.
56. Niebel, T. (2018). ICT and economic growth-Comparing developing, emerging and developed countries. World Development, 104, 197-211. Recuperado de http://doi.org/10.1016/j.worlddev.2017.11.024
57. Paunov, C., & Rollo, V. (2016). Has the internet fostered inclusive innovation in the developing world?. World Development, 78, 587-609. Recuperado de http://doi.org/10.1016/j.worlddev.2015.10.029
58. Phuc, P. N. K., Vincent, F. Y., & Chou, S. Y. (2013). Manufacturing production plan optimization in three-stage supply chains under Bass model market effects. Computers & Industrial Engineering, 65(3), 509-516. Recuperado de http://dx.doi.org/10.1016/j.cie.2013.02.019
59. Porath, D., & Schaefer, C. (2014). Applying the Bass model to pharmaceuticals in emerging markets. International Journal of Market Research, 56(4), 513-530. Recuperado de http://dx.doi.org/10.2501/IJMR-2014-033
60. Prince, J. T., & Simon, D. H. (2009). Has the Internet accelerated the diffusion of new products?. Research Policy, 38(8), 1269-1277. Recuperado de http://dx.doi.org/10.1016/j.respol.2009.06.008
61. Rogers, E. M. (1962). Diffusion of innovations. New York: Free Press.
62. Rogers, E. M. (2003). Diffusion of innovations. New York: Free Press.
63. Roller, L. H., & Waverman, L. (2001). Telecommunications infrastructure and economic development: A simultaneous approach. American economic review, 91(4), 909-923.
64. Santoleri, P. (2015). Diversity and intensity of information and communication technologies use and product innovation: evidence from Chilean micro-data. Economics of Innovation and New Technology, 24(6), 550-568. Recuperado de http://doi.org/10.1080/10438599.2014.946313
65. Schumpeter, J. A. (1982). Teoria do desenvolvimento econômico. São Paulo: Abril Cultural.
66. Schumpeter, J. A. (1942). Capitalismo, socialismo e democracia. Rio de Janeiro: Fundo de cultura.
67. Singh, S. K. (2008). The diffusion of mobile phones in India. TelecommunicationsPolicy, 32(9-10), 642-651. Recuperado de http://dx.doi.org10.1016/j.telpol.2008.07.005
68. Stenberg, P. L. (2018). The purchase of Internet subscriptions in Native American households. Telecommunications Policy, 42(1), 51-60. Recuperado de http://doi.org/10.1016/j.telpol.2017.08.003
69. Tan, Z., & Clark, T. H. (2000). Internet diffusion in the USA and China. info, 2(6), 595-604.
70. Turk, T., & Trkman, P. (2012). Bass model estimates for broadband diffusion in European countries. Technological Forecasting and Social Change, 79(1), 85-96. Recuperado de http://dx.doi.org10.1016/j.techfore.2011.06.010
71. Van der Boor, P., Oliveira, P., & Veloso, F. (2014). Users as innovators in developing countries: The global sources of innovation and diffusion in mobile banking services. Research Policy, 43(9), 1594-1607. Recuperado de http://doi.org/10.1016/j.respol.2014.05.003
72. Vu, K. M. (2011). ICT as a source of economic growth in the information age: Empirical evidence from the 1996-2005 period. Telecommunications Policy, 35(4), 357-372. Recuperado de http://doi.org/10.1016/j.telpol.2011.02.008
73. Waverman, L., Meschi, M., & Fuss, M. (2005). The impact of telecoms on economic growth in developing countries. The Vodafone policy paper series, 2(03), 10-24.
74. Wold Bank. Global economic prospects 2008: technology diffusion in the developing world. Global Economic Prospects and the Developing Countries (GEP). Washington, DC: World Bank Group. Recuperado de http://documents.worldbank.org/curated/en/2008/01/9013126/global-economic-prospects-technology-diffusion-developing-world-2008
75. World Bank. GDP PER CAPITA. Recuperado de http://data.worldbank.org/indicator/NY.GDP.PCAP.CD.
76. Wunnava, P. V., & Leiter, D. B. (2009). Determinants of intercountry Internet diffusion rates. American Journal of Economics and Sociology, 68(2), 413-426. Recuperado de http://dx.doi.org10.1111/j.1536-7150.2009.00634.x
77. Yamakawa, P., Rees, G. H., Salas, J. M., & Alva, N. (2013). The diffusion of mobile telephones: An empirical analysis for Peru. Telecommunications Policy, 37(6-7), 594-606. Recuperado de http://doi.org/10.1016/j.telpol.2012.12.010
78. Yousefi, A. (2011). The impact of information and communication technology on economic growth: evidence from developed and developing countries. Economics of Innovation and New Technology, 20(6), 581-596. Recuperado de http://doi.org/10.1080/10438599.2010.544470
79. Zaber, M., & Sirbu, M. (2012). Impact of spectrum management policy on the penetration of 3G technology. Telecommunications Policy, 36(9), 762-782. Recuperado de http://doi.org/10.1016/j.telpol.2012.06.012
© 2019 por los autores; licencia otorgada a la revista Estudios económicos. Este artículo es de acceso abierto y distribuido bajo los términos y condiciones de una licencia Atribución-No Comercial 3.0 Unported (CC BY-NC 3.0) de Creative Commons. Para ver una copia de esta licencia, visite http://creativecommons.org/licenses/by-nc/3.0/
